How to flash, test, and debug
To test and debug an application, you must first connect your device to the terminal and flash it with the build configuration you have created. Read the following sections for detailed steps.
How to connect to the terminal
Complete the following steps to connect your device:
- Plug in your device to the serial terminal or RTT using an USB cable. Your device appears on the Connected Devices View list.
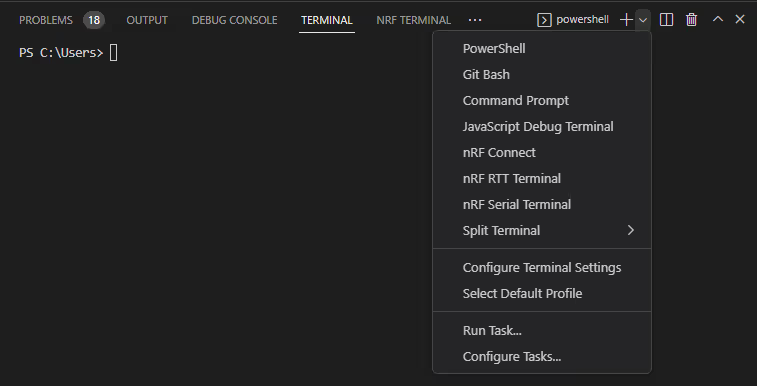
- Open the Panel View by pressing Ctrl-J.
- Click on the Terminal tab.
-
Expand the Launch Profile... drop-down list (the arrow next to the plus sign icon) located in the Panel Toolbar area.

-
Click on the nRF Serial Terminal option.
- Select the serial port from the Command Palette list.
The connection is started with the default preset configuration values and a notification appears in the terminal.
See the Panel Views page for more information and other ways to connect to the terminal.
How to flash an application
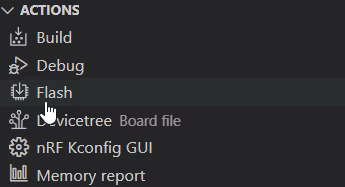
To flash the application you have built, click Flash in the Actions View after connecting the device to the terminal.

How to test an application
If you have built a sample or application included with the nRF Connect SDK without modifying it, you can test it by following the steps in the Testing section of its nRF Connect SDK documentation page. If you have made changes to your application, the steps may not be accurate for your use case, but you can still use them for reference.
To access the testing steps, open the nRF Connect SDK documentation page for the chosen application or sample. To do this from the extension, complete the following steps:
- In the Welcome View, click Browse samples. This opens the Sample Browser dialog.
- Type the name of the application or sample you have built and want to test. You can also use one of the available Sample browser filters to filter the list.
- Hover over the application or sample entry in the list. The Open Documentation button appears.
- Click the Open Documentation button. The documentation page opens in the browser.
Follow the steps listed in the Testing section on the opened page.
How to debug an application
Complete the steps listed here to debug an nRF Connect SDK application or sample in Visual Studio Code.
Note
Ubuntu users with nRF Connect SDK v1.7.0 need to install the libcurses5 package for debugging to work properly. Run the following command:
sudo apt install libncurses5
How to enable debugging
Complete the following steps to enable debugging, if you have not already done so when setting up a build configuration:
- Make sure that your device is connected to your computer with an USB cable.
- Right-click the build configuration in the Applications View. A drop-down menu appears.
- Click Edit Build Configuration.
- On the Edit Build Configuration screen, go to the Optimization level drop-down menu.
- In the menu, select Optimize for debugging.
- Click Build Configuration. The build configuration is rebuilt with the full set of debug options enabled and the device is reflashed automatically.
How to start debugging
To start debugging, click Debug in the Actions View. The debugging toolbar appears at the top of the screen to let you control the debugging process.
For a more detailed explanation of the debugger that the extension uses, see the Debugging an application page. See also the the VS Code's debugging documentation for general information about how debugging in VS Code works.