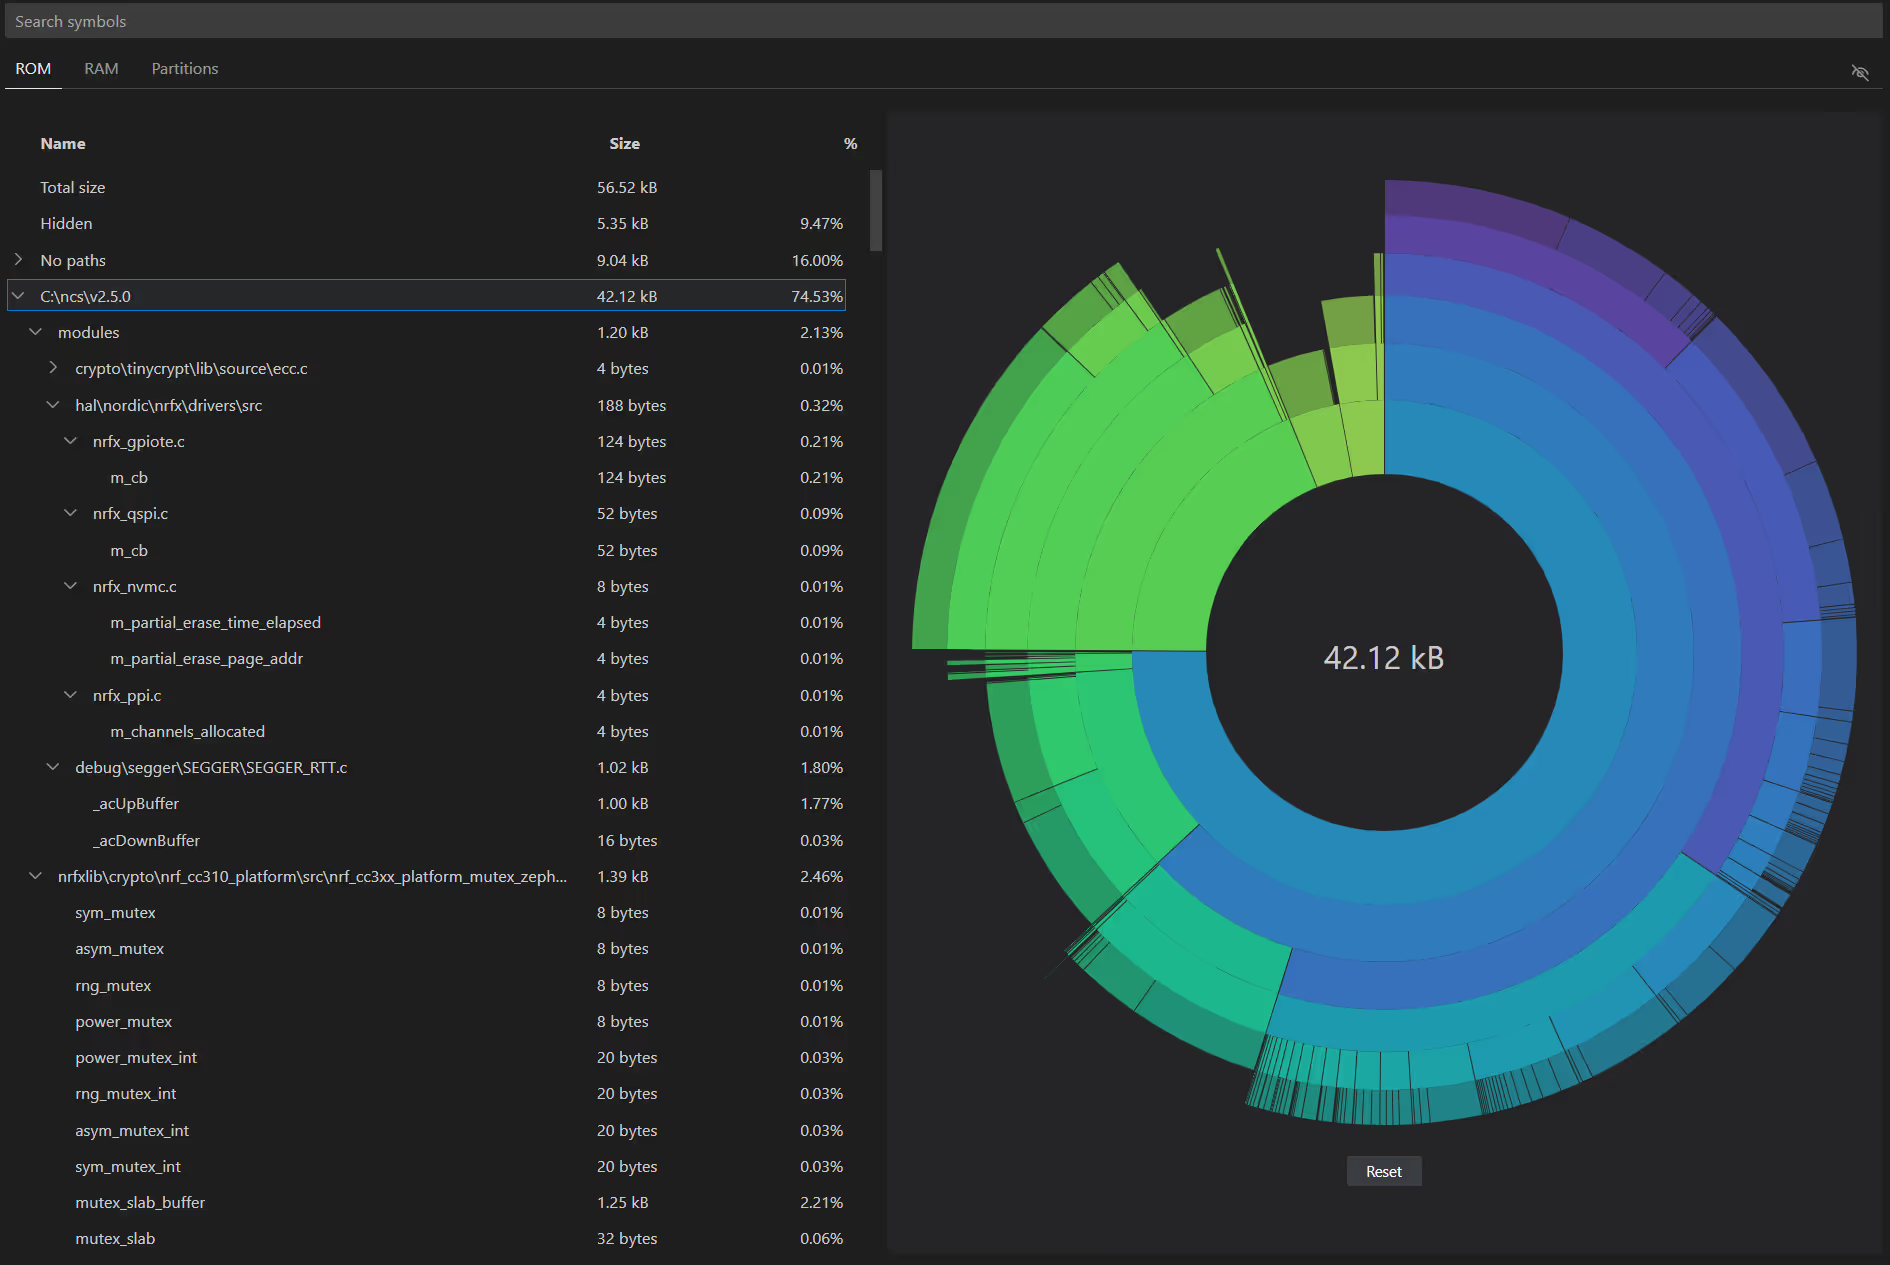
Memory report overview
The memory report shows the size and percentage of memory that each symbol uses on your device for RAM, ROM, and partitions (when applicable) for a particular application. If you have an application that has too high memory requirements, this kind of information can help you understand how much space each symbol uses and where you can potentially reduce the memory usage.
The memory report feature is based on Zephyr's Footprint and Memory Usage reports. It generates a treeview and interactive sunburst chart of the memory usage. The sunburst chart presents sections in premade stacks to see how the memory is allocated so you can optimize your application accordingly through Kconfig settings. The organization of both the treeview and the chart is inherited from Zephyr reporting system.
See the How to use a memory report and Memory report UI pages for more information about this feature.
