How to use a memory report
The memory report feature allows you to generate, navigate, and sort a visual representation of your application's memory.
How to generate a memory report
To generate a memory report for your application, click Memory report in the Actions View. A progress notification bar appears in the bottom right corner of the screen.
When the report generation finishes, two memory reports automatically open in the editor, one for RAM and one for ROM, similar to Zephyr's Footprint and Memory Usage reports.
The data for these reports in the extension is stored in the ram.json and rom.json files, respectively, which are saved in the application's build configuration folder.
The following exceptions can apply to the report generation:
- If you have several build configurations, a memory report will only be generated for the currently-selected build configuration.
- If you have an invalid build configuration, a failure warning will display when you try to generate the report.
- If any changes have been made to your device or its application, you must rebuild the application and regenerate the memory report for it to display the updated information.
How to navigate the memory report
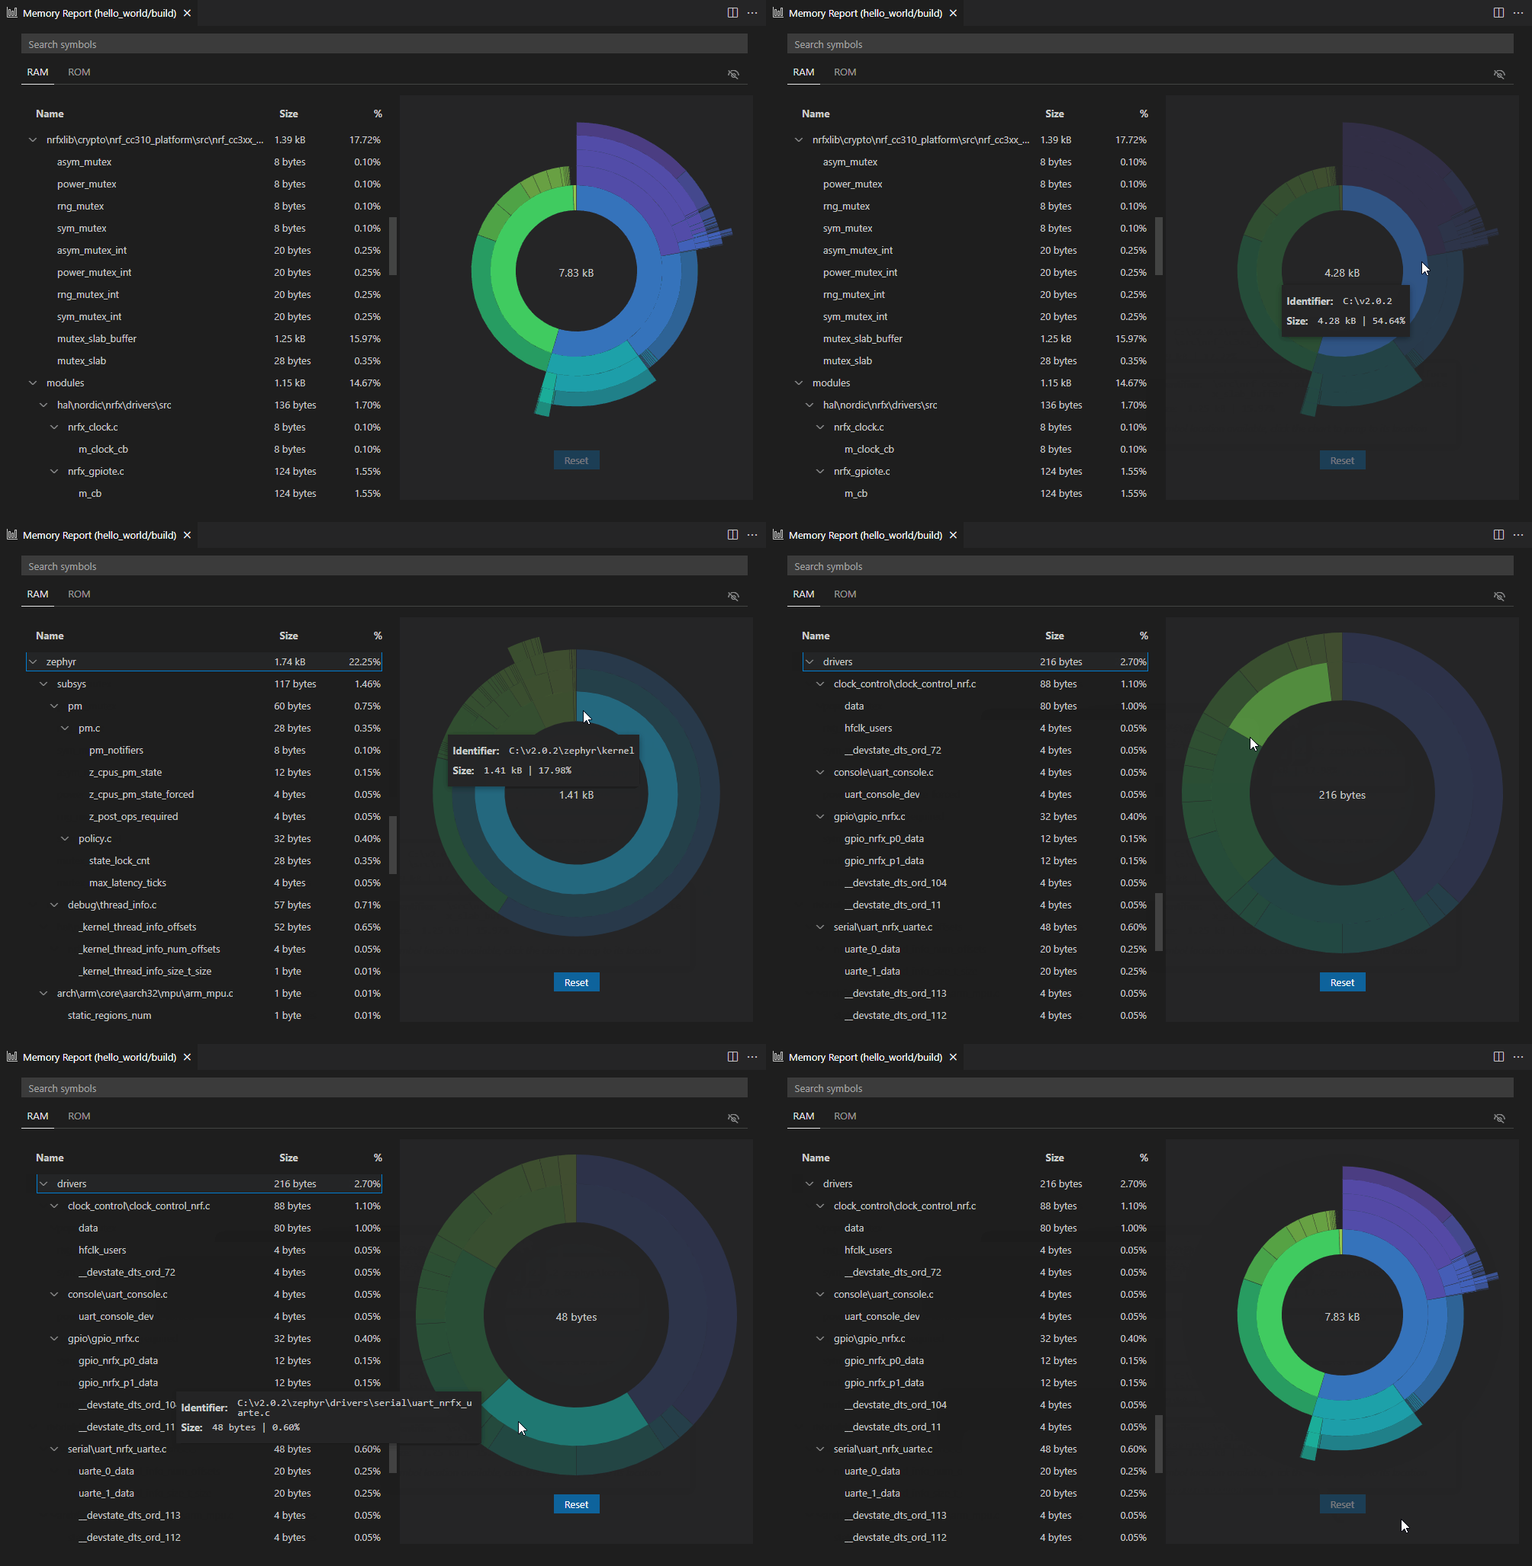
The memory report includes the stack treeview and the sunburst memory diagram. The treeview lists directories and files that are included in the memory report. The sunburst diagram displays directories and files of the stack in a top-down manner, with the single files located in the farthest circle from the center.
To navigate the sunburst treeview of the memory report:
- Hover over the different sections of the sunburst diagram to see the identifier and the percentage of memory that it uses.
- Click on the chosen section to access the lower levels.
Tip
When you want to move to higher levels, click the Reset button to restart the navigation.
For the full list of possible actions in the treeview and in the sunburst diagram, see the Memory report UI reference page.
The following GIF shows the interaction with the sunburst diagram:
