Version 2022.11.140
Welcome to the November 2022 release of nRF Connect for VS Code.
In this release, we have been working on improving the following areas:
- Debugging improvements
- Improved messages and fixed errors
- Documentation restructure
- Other improvements
- Partition overlaps in memory report
- New Clean Build Configuration task and command
- Pristine build and Erase and Flash to Board task bindings
- Variables inserted when generating a new workspace
- Tags and samples manually defined for new workspace applications
- Git repository initialization in the new application's directory
- Bug fixes
We rely on feedback from our users to make the VS Code extensions as useful and stable as possible. Each release includes several features and bug fixes suggested by our users. We highlight these changes with a dedicated tag in the release notes: 
If you have any suggestions for new features or bugs that need fixing, you can submit them through the extension's built-in feedback form or the Nordic DevZone
Fixes in 2023.1.44
- Fixed an issue with the detection of the
west flash--dev-idargument, which was introduced when the old--snroption was deprecated in Zephyr Pull request #52662. - Fixed an issue with the Build All Configurations button in the Applications View's Toolbar, which became unresponsive after a change in the VS Code v1.72.
Fixes in 2023.2.56
- Fixed a bug where the device quickpick would disappear shortly after opening.
- Fixed a bug where the board roots were mistakenly converted to absolute paths.
- Fixed a bug where the new build configuration window didn't load.
Debugging improvements
We made several improvements to the debugging experience within the default nrf-connect debug type and an improvement for debugging within Ozone.
nRF Debug Thread Viewer
We added several new features and improvements specifically to the nRF Debug Thread Viewer.
Read current thread's stack pointer from register
The Thread Viewer now uses the live stack pointer register to determine the current stack pointer of the running thread. Previously, it would show the thread's stack pointer value from the last context switch.
Thread state icons 
The Thread Viewer now features icons to the left of the Name column. These icons describe the state of each thread and are based on Zephyr's thread states. Hover your cursor over the icons to reveal a description of the thread's state.
Clickable thread locations
You can click on the Name of the thread to reveal its location in the source file.

Items in the Entry column are also clickable. Click the entry point function name to go to their source file location, whenever the location of the entry is known.
Display stack usage
We changed the previous Thread Viewer's Stack Pointer column to the Stack Usage column which renders a small progress bar below the text. This column now illustrates the thread's current stack usage compared to its total allocated stack area, and can be used to identify stack size issues.

nRF Debug Memory Viewer
We added several new features and improvements specifically to the nRF Debug Memory Viewer.
Clickable symbol name links
We added a feature where the Symbol names are now clickable links that will direct you to their source file location, whenever their location is known.

Tooltip can now stay in place
Cells in the Memory Viewer can now be clicked on to make the tooltip stay in place. Clicking again hides the tooltip. This is useful for keeping the tooltip information present while hovering over different values in the Viewer. The tooltip will disappear upon scrolling up or down in the Viewer, but will reappear when you scroll back to the cell's location.

Removed table header row
We removed the nRF Debug Memory Viewer table headers Address, Hex, and ASCII.

Now, there are four buttons in the Memory Viewer's Toolbar.

The buttons cover the following actions (listed in the order they appear):
- Go to symbol - provides a drop-down menu of symbols represented by the Viewer.
- Go to address - displays an input line to enter an address to jump to.
- Hide symbols - turns off the color groupings of the symbols presented in the Viewer.
- Show ASCII - shows the associate ASCII on the right side of the Viewer.
New Configure debugging button
We added a configuration button for the Debug button in the Actions View. This button acts as a shortcut for creating a launch.json file to add custom launch and debug configurations. Hover your cursor over the Debug button to reveal the Configure debugging button with the cogwheel icon.
The Configure debugging button is similar to the Bind Task to Action button for building and flashing options. Unlike the task binding, however, you can only configure one launch configuration for each build. Additionally, you can instantly configure the current configuration and bind it at the same time.

This new feature allows you also to add custom parameters to the launch.json file and later commit them to share it with other users. Any launch configuration can be bound to the Actions View > Debug button.
If you have a customized Cortex Debug or even a Python launch configuration that you would like to trigger on a specific build, you can do so from the context menu. As this adds the debug configuration to a launch.json file, you can also start debugging from VS Code's Activity Bar > Run and Debug by selecting the launch configuration in the Run and Debug Sidebar View.
New debug configuration fields
We added several new debug configuration fields and added support for variables that let you reference dynamic concepts that the extension resolve during the debug session setup. This opens up new debugging use cases, like launching against a server that is already running, targeting non-localhost servers, or using other servers than SEGGER's (for example, west debug.)
The new debug configuration fields are:
serverArgs- Overrides the arguments to pass to the GDB Server.serverAddress- Sets the address and port for the GDB server.svdPath- Sets the path to the .svd file describing the device. Leave blank to have the extension automatically select the path to this file.logging- Emits program output.flashBreakpoints- Enable or disable flash breakpoints.
The debug configuration's config field now also supports standard variables, such as ${workspaceRoot}.
Read more about this on the customizing debugging page and the debugging UI page.
Custom memory tab
We added a new feature to the nRF Debug Memory Viewer that allows you to add a custom-defined memory tab.
This requires adding a configuration into your launch.json file, where you set the starting memory address that you want to be displayed. The custom tab is then displayed during debugging as the third tab to the right of flash and ram, titled with the name you have assigned.
This feature provides you a focused view of a specific memory address on your device, instead of having to scroll through all memory addresses within the flash and RAM of the device. Read the Memory Explorer guide page for more details and instructions on how to use this addition.

Debugger skipping secondary images on entry 
We changed the way the debugger's entry point is identified. This is to ensure that the debugger stops in the user application's main function and not in the main function of any auxiliary application, such as the bootloader or the Trusted Firmware-M image.
Debugging Peripherals View
We added several new features and improvements to the Debugging Peripherals View.
CMSIS Core peripherals 
CMSIS Core peripherals, such as the NVIC and SCB registers, are now shown in the peripheral tree for Cortex M0, Cortex M4, and Cortex M33 devices.
Write to registers
In the previous release, the Peripherals View was a read-only representation of the hardware peripherals and their registers. For this release, we have added write support to all writeable registers.
Values can either be assigned directly to the register or to specific fields within the register. We have added custom workflows for registers with special behavior in Nordic's devices, such as the TASK and EVENT registers, as well as drop-down selections for fields with a limited set of valid values (such as the GPIO Pin configuration's direction field, which can be either "Input" or "Output").
Improvement to flashing when debugging with Ozone 
We implemented an improvement to the Debug with Ozone button (available from the Actions View.) Ozone project files are now handled differently in the extension so that Ozone flashes the merged HEX file of a build instead of the ELF file before debugging.
Improved messages and fixed errors
The following improvements were made to messages and errors shown in the extension:
-
Added a notification that appears when selecting the multi-core SoC to build targets that have an
_nsvariant. The notification appears when you select the build target version without_nsand invites you to consider using the_nsvariant. -
Added a warning in the Status Bar whenever an SDK or toolchain is not selected. You can hover over the item to check the current configuration. The extension will default to the last installed SDK and toolchain version.
-
Updated the notification about the invalid toolchain installation for cases when SEGGER J-Link is not installed.
-
Updated how the terminal output of nrfjprog is displayed, so that it now includes line separation to make the output clearer.
-
Fixed an issue where the extension would not validate the directory path when adding an existing application. This led to issues if the path was changed outside of VS Code. Now, the extension will run a path validation check when adding an existing application just as it does when creating a new application.
Documentation restructure
In this release, we restructured our documentation. The documentation is now organized in the following tabs:
- Get started - quick guides for getting started with the extension pack. Includes basic instructions on how to install and set setup nRF Connect SDK and the toolchain, as well as how to build, flash, test, and debug an application.
- Guides - guides for different features and actions within the extension pack and VS Code environment. These pages are more detailed than the getting started ones and focus on more advanced usage.
- UI and reference - overview of the UI elements within the extension pack and VS Code, as well as of the referential material, such as settings, commands, and keybindings.
- Release notes - all four extensions' release notes, organized by date.
With the restructuring, we wanted to organize the information by usage rather than by features of each extension.
Other improvements
Here are some of the other improvements we made to the extension.
Partition overlaps in Memory report 
We improved the Partitions report within the Memory report, so that it now displays a parent-child tree structure when applicable. The Partitions report will now recognize contained partitions relative to their container partition by rendering them indented.

New Clean Build Configuration task and command 
We added a Clean Build Configuration command to the More actions... expandable menu for build configuration within the build folder in the Applications View. Clean Build Configuration removes most files generated during the building process but keeps the configuration and backup files. This action executes west build -t clean for the given build configuration.

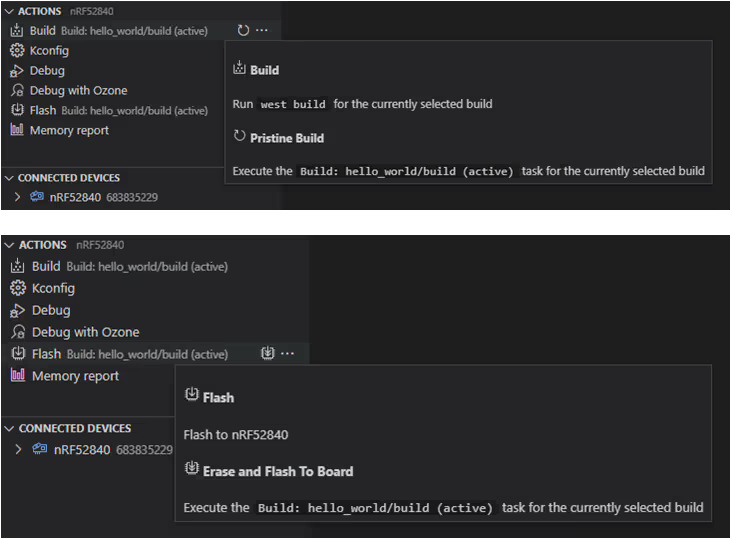
Pristine build and Erase and Flash to Board task bindings 
We extended the Bind Task to Action feature so that it now allows custom bindings for the Pristine Build and Erase and Flash to Board actions as well. Read the Binding custom tasks to actions page for more details and instructions on how to use this.
Additionally, custom flash tasks are now executed when the Flash All command is executed. The task will run for every linked device.
Variables inserted when generating a new workspace 
We added a feature where, when creating a new freestanding application, variables will now be inserted in the workspace settings instead of absolute paths.
Tags and samples manually defined for new workspace applications
We added a feature to the Create a new application screen that allows you to manually define tags and samples when creating a workspace application if the connection to GitHub fails.
Git repository initialization in the new application's directory 
When building a new application, the extension will now initialize a Git repository in the generated application directory and create a .gitignore file. The .gitignore file is placed by the at the root of the created folder.
Bug fixes
Several bugs were fixed in this release.
Show full path to collapsed folders
When source files are located inside several subdirectories that do not contain any other files, the source files' tree renders collapsed versions of the directory to avoid unnecessarily "deep" trees. A regression in the previous release caused the collapsed directory to only show the name of the deepest directory, instead of the full collapsed path. This has now been fixed so that these nested directories are clearly labeled with all the collapsed directory names.
Added CMake preset variables to BOARD_ROOTS
We implemented a change where absolute paths in the CMakePresets.json file's BOARD_ROOTS variable are now portable. Previously, there would be issues with how the board roots were handled when the preset file was used by the Add Build Configuration screen.
Fixed CMake preset variable interpretation
We fixed an issue where the preset variables that are injected in the CMakePresets.json file ($sourceDir, $sourceParentDir, and $env{ZEPHYR_BASE}) would not be interpreted correctly in the west build command which would use the named preset when generating a build configuration.
Fixed parsing and merging of the -DBOARD_ROOT= argument
When creating a build command, the -DBOARD_ROOT= argument would be added multiple times when BOARD_ROOT was included in the CMake preset. This would override the first instance. This is now fixed, and the arguments are parsed and merged correctly.
Fixed duplicate sample browser boards 
We fixed a bug that appeared on Windows machines, where some boards would be shown twice in the board list in the Add Build Configuration screen.
Fixed sample entries in the Sample Browser list
We fixed an issue where searching for a sample in the Create a new application > Sample Browser screen would show folders that did not contain a sample.yaml file, and therefore could not be selected.
Fixed display of peripherals on Windows 
We fixed a bug where the debugger's Peripheral View in the Sidebar would fail to display any peripherals on Windows machines.
Replaced text for the extension's Welcome page
We updated the link label on the Welcome page that incorrectly mentioned local documentation. It now refers and links to the local version of the extension's Marketplace pages in VS Code.