Tooling and Troubleshooting
Table of Contents
General overview of tools used to troubleshoot the template code and/or modem/network behavior. For more knowledge on debugging and troubleshooting nRF Connect SDK based applications in general, refer to these links:
- Debugging and troubleshooting
- Cellular IoT Fundamentals Developer Academy Course
- nRF Connect SDK Debugging Guide
- Zephyr Debugging Guide
Shell Commands
The template provides several shell commands for controlling and monitoring device behavior. Connect to the device’s UART interface using either:
- Your preferred terminal application (e.g.,
putty,minicom,terraterm) - nRF Connect for Desktop Serial terminal application
Available Commands
Run help to list all available commands:
uart:~$ help
Available commands:
  at                 : Execute an AT command
  att_button_press   : Asset Tracker Template Button CMDs
  att_cloud_publish  : Asset Tracker Template Cloud CMDs
  att_network        : Asset Tracker Template Network CMDs
  clear              : Clear screen.
  date               : Date commands
  device             : Device commands
  devmem             : Read/write physical memory
                       Usage:
                       Read memory at address with optional width:
                       devmem <address> [<width>]
                       Write memory at address with mandatory width and value:
                       devmem <address> <width> <value>
  help               : Prints the help message.
  history            : Command history.
  kernel             : Kernel commands
  mflt               : Memfault Test Commands
  mflt_nrf           : Memfault nRF Connect SDK Test Commands
  pm                 : PM commands
  rem                : Ignore lines beginning with 'rem '
  resize             : Console gets terminal screen size or assumes default in
                       case the readout fails. It must be executed after each
                       terminal width change to ensure correct text display.
  retval             : Print return value of most recent command
  shell              : Useful, not Unix-like shell commands.
Shell Command Examples
Cloud Publishing
uart:~$ att_cloud_publish TEMP "24"
Sending on payload channel: {"messageType":"DATA","appId":"TEMP","data":"24","ts":1744359144653} (68 bytes)
Network disconnect
uart:~$ att_network disconnect
[00:00:36.758,758] <dbg> network: state_disconnecting_entry: state_disconnecting_entry
[00:00:37.196,746] <wrn> network: Not registered, check rejection cause
[00:00:37.197,021] <inf> network: Network connectivity lost
[00:00:37.198,608] <dbg> cloud: state_connected_paused_entry: state_connected_paused_entry
[00:00:37.198,974] <dbg> main: wait_for_trigger_exit: wait_for_trigger_exit
[00:00:37.199,005] <dbg> main: idle_entry: idle_entry
[00:00:37.205,444] <dbg> network: state_disconnected_entry: state_disconnected_entry
AT Command Execution
uart:~$ at at+cgsn
+CGSN: "123456789012345"
OK
uart:~$ at at+cpsms?
+CPSMS: 1,,,"00001100","00000011"
OK
Debugging Tools
Low Power Profiling
To get a rough estimate of the power consumption of the device and what you should expect depending on your network configuration and data transmission, you can use the Online Power Profiler for LTE.
For exact measurements, it’s recommended to use a Power Analyzer or the PPK: Power Profiler Kit 2.
For detailed guidance on how the PPK can be used to profile and measure power, see:
GDB Debugging
Debug the template using GDB via west commands:
# Attach GDB, skip rebuilding application
west attach --skip-rebuild
Common GDB commands:
(gdb) tui enable
(gdb) monitor reset
(gdb) break main
(gdb) continue
(gdb) backtrace
(gdb) print variable_name
(gdb) next
(gdb) step
For more information, see:
SEGGER SystemView
Analyze thread execution and scheduling using SEGGER SystemView.
Configuration
Add to prj.conf:
CONFIG_TRACING=y
CONFIG_SEGGER_SYSTEMVIEW=y
And build/flash the template for the respective board. Or build with the necessary configurations passed in via the west build command:
west build -p -b <board> -- -DCONFIG_TRACING=y -DCONFIG_SEGGER_SYSTEMVIEW=y
Or RTT tracing snippet:
west build -p -b <board> -- -Dapp_SNIPPET=rtt-tracing
Thread Analysis
Monitor and optimize stack sizes using the Thread Analyzer:
Add to prj.conf:
CONFIG_THREAD_ANALYZER=y
CONFIG_THREAD_ANALYZER_USE_LOG=y
CONFIG_THREAD_ANALYZER_AUTO=y
CONFIG_THREAD_ANALYZER_AUTO_INTERVAL=30
CONFIG_THREAD_ANALYZER_AUTO_STACK_SIZE=1024
CONFIG_THREAD_NAME=y
The listed configurations configure the thread analyzer to print thread information every 30 seconds:
[00:00:30.725,463] <inf> thread_analyzer:  location_api_workq  : STACK: unused 376 usage 3720 / 4096 (90 %); CPU: 0 %
[00:00:30.725,494] <inf> thread_analyzer:                      : Total CPU cycles used: 242
[00:00:30.725,738] <inf> thread_analyzer:  downloader          : STACK: unused 1480 usage 184 / 1664 (11 %); CPU: 0 %
[00:00:30.725,769] <inf> thread_analyzer:                      : Total CPU cycles used: 0
[00:00:30.725,891] <inf> thread_analyzer:  thread_analyzer     : STACK: unused 480 usage 544 / 1024 (53 %); CPU: 0 %
[00:00:30.725,921] <inf> thread_analyzer:                      : Total CPU cycles used: 148
[00:00:30.725,982] <inf> thread_analyzer:  power_task_id       : STACK: unused 168 usage 1176 / 1344 (87 %); CPU: 0 %
[00:00:30.726,013] <inf> thread_analyzer:                      : Total CPU cycles used: 85
[00:00:30.726,104] <inf> thread_analyzer:  network_module_thread_id: STACK: unused 160 usage 1504 / 1664 (90 %); CPU: 0 %
[00:00:30.726,165] <inf> thread_analyzer:                      : Total CPU cycles used: 2011
[00:00:30.726,257] <inf> thread_analyzer:  location_module_thread_id: STACK: unused 216 usage 1000 / 1216 (82 %); CPU: 0 %
[00:00:30.726,287] <inf> thread_analyzer:                      : Total CPU cycles used: 185
[00:00:30.726,440] <inf> thread_analyzer:  fota_task_id        : STACK: unused 968 usage 1536 / 2504 (61 %); CPU: 0 %
[00:00:30.726,470] <inf> thread_analyzer:                      : Total CPU cycles used: 187
[00:00:30.726,562] <inf> thread_analyzer:  environmental_task_id: STACK: unused 168 usage 856 / 1024 (83 %); CPU: 0 %
[00:00:30.726,593] <inf> thread_analyzer:                      : Total CPU cycles used: 37
[00:00:30.726,715] <inf> thread_analyzer:  coap_client_recv_thread: STACK: unused 592 usage 688 / 1280 (53 %); CPU: 0 %
[00:00:30.726,745] <inf> thread_analyzer:                      : Total CPU cycles used: 273
[00:00:30.726,867] <inf> thread_analyzer:  cloud_thread_id: STACK: unused 328 usage 3000 / 3328 (90 %); CPU: 0 %
[00:00:30.726,898] <inf> thread_analyzer:                      : Total CPU cycles used: 1081
[00:00:30.726,959] <inf> thread_analyzer:  date_time_work_q    : STACK: unused 80 usage 368 / 448 (82 %); CPU: 0 %
[00:00:30.726,989] <inf> thread_analyzer:                      : Total CPU cycles used: 11
[00:00:30.727,050] <inf> thread_analyzer:  conn_mgr_monitor    : STACK: unused 72 usage 312 / 384 (81 %); CPU: 0 %
[00:00:30.727,081] <inf> thread_analyzer:                      : Total CPU cycles used: 13
[00:00:30.727,203] <inf> thread_analyzer:  work_q              : STACK: unused 576 usage 192 / 768 (25 %); CPU: 0 %
[00:00:30.727,233] <inf> thread_analyzer:                      : Total CPU cycles used: 3
[00:00:30.727,294] <inf> thread_analyzer:  rx_q[0]             : STACK: unused 24 usage 168 / 192 (87 %); CPU: 0 %
[00:00:30.727,325] <inf> thread_analyzer:                      : Total CPU cycles used: 1
[00:00:30.727,386] <inf> thread_analyzer:  tx_q[0]             : STACK: unused 24 usage 168 / 192 (87 %); CPU: 0 %
[00:00:30.727,416] <inf> thread_analyzer:                      : Total CPU cycles used: 1
[00:00:30.727,539] <inf> thread_analyzer:  net_mgmt            : STACK: unused 504 usage 776 / 1280 (60 %); CPU: 0 %
[00:00:30.727,569] <inf> thread_analyzer:                      : Total CPU cycles used: 124
[00:00:30.727,783] <inf> thread_analyzer:  shell_uart          : STACK: unused 1312 usage 736 / 2048 (35 %); CPU: 0 %
[00:00:30.727,813] <inf> thread_analyzer:                      : Total CPU cycles used: 3971
[00:00:30.727,905] <inf> thread_analyzer:  sysworkq            : STACK: unused 400 usage 880 / 1280 (68 %); CPU: 0 %
[00:00:30.727,935] <inf> thread_analyzer:                      : Total CPU cycles used: 278
[00:00:30.728,027] <inf> thread_analyzer:  nrf70_intr_wq       : STACK: unused 120 usage 712 / 832 (85 %); CPU: 0 %
[00:00:30.728,057] <inf> thread_analyzer:                      : Total CPU cycles used: 806
[00:00:30.728,118] <inf> thread_analyzer:  nrf70_bh_wq         : STACK: unused 112 usage 656 / 768 (85 %); CPU: 0 %
[00:00:30.728,149] <inf> thread_analyzer:                      : Total CPU cycles used: 102
[00:00:30.728,271] <inf> thread_analyzer:  logging             : STACK: unused 448 usage 320 / 768 (41 %); CPU: 0 %
[00:00:30.728,302] <inf> thread_analyzer:                      : Total CPU cycles used: 224
[00:00:30.728,363] <inf> thread_analyzer:  idle                : STACK: unused 256 usage 64 / 320 (20 %); CPU: 98 %
[00:00:30.728,393] <inf> thread_analyzer:                      : Total CPU cycles used: 985191
[00:00:30.728,485] <inf> thread_analyzer:  main                : STACK: unused 208 usage 1648 / 1856 (88 %); CPU: 0 %
[00:00:30.728,515] <inf> thread_analyzer:                      : Total CPU cycles used: 2055
[00:00:30.728,759] <inf> thread_analyzer:  ISR0                : STACK: unused 1736 usage 312 / 2048 (15 %)
For more information, see Zephyr Thread Analyzer
Hardfaults
When a hardfault occurs, the LR and PC registers can be looked up in order to find the offending instruction.
For example, in this fault frame the PC is 0x00002681, thread is main and type of error is a stack overflow.
So in this case, there is no need to look up the PC or LR to understand the issue.
The main stack size needs to be increased.
For more information on how to debug hardfaults, see Memfault Cortex Hardfault debug
*** Using Zephyr OS v4.0.99-7607c6585566 ***
[00:00:00.756,317] <dbg> main: main: Main has started
[00:00:00.764,770] <err> os: ***** USAGE FAULT *****
[00:00:00.772,552] <err> os:   Stack overflow (context area not valid)
[00:00:00.781,951] <err> os: r0/a1:  0x0000267e  r1/a2:  0x0007b6f7  r2/a3:  0x0000267f
[00:00:00.792,785] <err> os: r3/a4:  0x0007b6f7 r12/ip:  0x00002680 r14/lr:  0x0007b6f7
[00:00:00.803,619] <err> os:  xpsr:  0x0007b600
[00:00:00.811,035] <err> os: s[ 0]:  0x00002682  s[ 1]:  0x0007b6f7  s[ 2]:  0x00002683  s[ 3]:  0x0007b6f7
[00:00:00.823,608] <err> os: s[ 4]:  0x00002684  s[ 5]:  0x0007b6f7  s[ 6]:  0x00002685  s[ 7]:  0x0007b6f7
[00:00:00.836,212] <err> os: s[ 8]:  0x00002686  s[ 9]:  0x0007b6f7  s[10]:  0x00002687  s[11]:  0x0007b6f7
[00:00:00.848,815] <err> os: s[12]:  0x00002688  s[13]:  0x0007b6f7  s[14]:  0x00002689  s[15]:  0x0007b6f7
[00:00:00.861,389] <err> os: fpscr:  0x0000268a
[00:00:00.868,774] <err> os: Faulting instruction address (r15/pc): 0x00002681
[00:00:00.878,845] <err> os: >>> ZEPHYR FATAL ERROR 2: Stack overflow on CPU 0
[00:00:00.888,916] <err> os: Current thread: 0x200132b8 (main)
[00:00:00.897,583] <err> os: Halting system
However, if the fault source is more ambiguous it might be needed to use Address-2-Line to lookup the offending function. In this example, the LR address is used to find the function address stored in the LR register. This function is the parent in the callstack of the address the PC points to.
<path-to-zephyr-sdk>/arm-zephyr-eabi/bin/arm-zephyr-eabi-addr2line -e build/app/zephyr/zephyr.elf 0x0007b6f7
<path-to-app-dir>/app/src/main.c:771
The template is configured to forward logging in TF-M (Secure image) to UART 0 (application log output). If a secure fault occurs, the fault frame from TF-M will look like this:
uart:~$ FATAL ERROR: SecureFault
Here is some context for the exception:
    EXC_RETURN (LR): 0xFFFFFFAD
    Exception came from non-secure FW in thread mode.
    xPSR:    0x60000007
    MSP:     0x20000BF8
    PSP:     0x20001CF8
    MSP_NS:  0x2002C580
    PSP_NS:  0x2002CD40
    Exception frame at: 0x2002CD40
        R0:   0x00000000
        R1:   0x00000000
        R2:   0x20013288
        R3:   0x00000000
        R12:  0x00000000
        LR:   0x00044181
        PC:   0x0003D7B6
        xPSR: 0x61000000
    Callee saved register state:        R4:   0x2000D414
        R5:   0x0008A0B8
        R6:   0x00088835
        R7:   0x00000000
        R8:   0x00000000
        R9:   0x00000008
        R10:  0x00048A04
        R11:  0x00048A04
    CFSR:  0x00000000
    BFSR:  0x00000000
    BFAR:  Not Valid
    MMFSR: 0x00000000
    MMFAR: Not Valid
    UFSR:  0x00000000
    HFSR:  0x00000000
    SFSR:  0x00000048
    SFAR: 0x00000000
Here we can again lookup the PC and LR in the Non-Secure image to find the offending function:
~/dev/projects/att/Asset-Tracker-Template/app add-sensor-docs *18 !5 ❯ a2l 0x0003D7B6
/dev/projects/att/Asset-Tracker-Template/app/src/main.c:789
Secure faults will display:
- Fault frame information
- Non-secure SP and LR registers
- Violation details
For more information:
NOTE It may be that upon a hardfault, the fault frame is not printed due to the device rebooting before the log buffer is flushed. To circumvent this issue add the following configurations:
CONFIG_LOG_MODE_IMMEDIATE=y
CONFIG_RESET_ON_FATAL_ERROR=n
Note that when enabling immediate logging, it might be necessary to increase the stack size of certain threads due to logging being executed in context which increases stack usage.
Memfault Remote Debugging
The template supports remote debugging via Memfault. Remote debugging enables the device to send metrics suchs as LTE, GNSS and memory statistics as well as coredump captures on crashes to analyse problems across single or fleet of devices once they occur.
For more information see:
Recommended Prerequisites
- Register at Memfault
- Complete the Remote Debugging with Memfault exercise.
- Memfault project key retrieved during the aforementioned steps.
To build the application with support for Memfault you need to build with the Memfault overlay overlay-memfault.conf. If you want to capture and send modem traces to Memfault on coredumps, you can include the overlay overlay-publish-modem-traces-to-memfault.conf.
If you also want to upload the Embedded Trace Buffer you can include the overlay overlay-etb.conf.
Important Note on Data Usage: Enabling Memfault will increase your device’s data usage. This is especially true when using the modem trace upload feature, which can send upwards of 1MB of modem trace data in case of application crashes. Consider this when planning your data usage and costs.
For detailed build instructions and how to configure the project key, refer to the Getting Started Guide where build instructions for building with Memfault are given. To build with all available Memfault functionality:
west build -p -b <board> -- -DEXTRA_CONF_FILE="overlay-memfault.conf;overlay-upload-modem-traces-to-memfault.conf;overlay-etb.conf" -DCONFIG_MEMFAULT_NCS_PROJECT_KEY=\"<project-key>\"
Screen capture from a coredump received in Memfault:
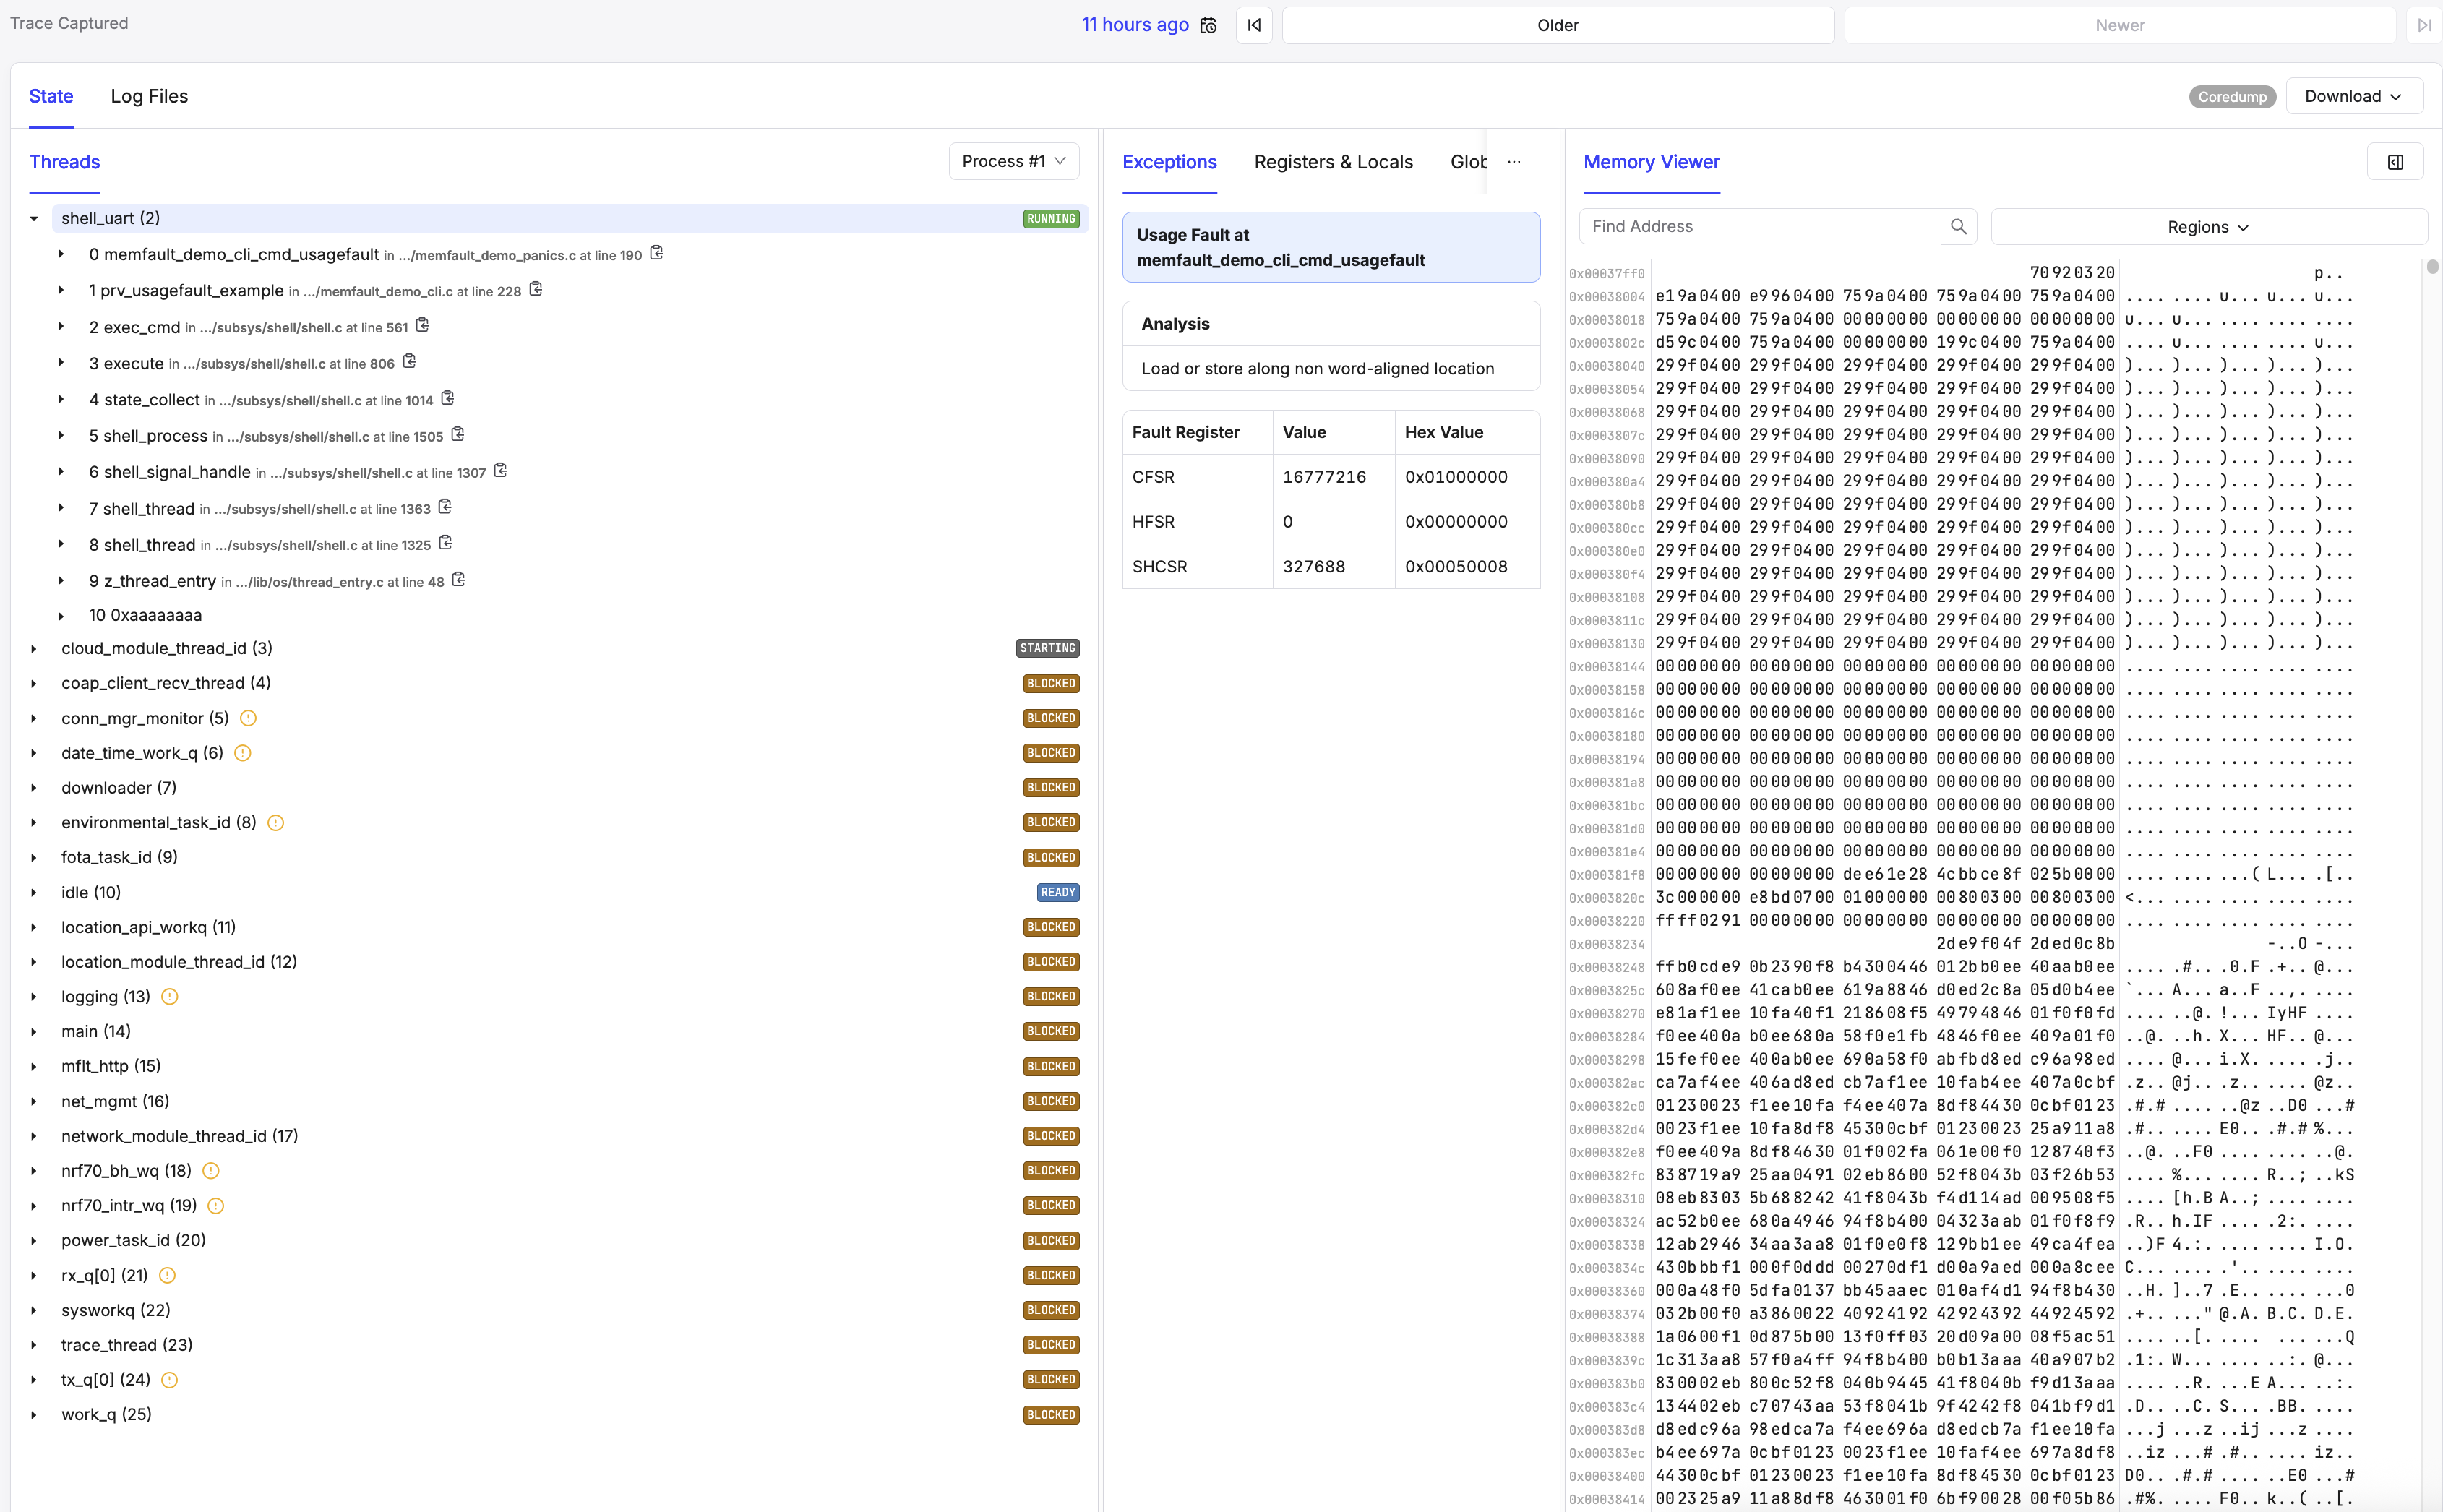
IMPORTANT In order to properly use Memfault and be able to decode metrics and coredumps sent from the device, you need to upload the ELF file located in the build folder of the template once you have built the application. This is covered in the Remote Debugging with Memfault developer Academy excersise.
Test shell commands
Trigger test faults using shell commands:
uart:~$ mflt_nrf test hardfault
uart:~$ mflt_nrf test assert
uart:~$ mflt_nrf test usagefault
Modem Tracing
Capture and analyze modem behavior live (AT, LTE, IP) via Wireshark.
UART Tracing
Build with:
west build -p -b <board> -- -Dapp_SNIPPET=nrf91-modem-trace-uart
Capture traces using nRF Connect for Desktop Cellular Monitor application or manually using nRF Util:
nrfutil trace lte --input-serialport /dev/tty.usbmodem141405 --output-pcapng trace.pcapng
~/pcap ❯ nrfutil trace lte --input-serialport /dev/tty.usbmodem141405 --output-pcapng trace.pcapng                                                                                                                                    10:25:31
⠒ Saving trace to trace.pcapng (11952 bytes)
If not traces are captured it might be needed to reset the device. After capturing the trace it can be opened in wireshark:
wireshark trace.pcapng
You can also do live tracing by piping the traces to wireshark:
nrfutil trace lte --input-serialport /dev/tty.usbmodem141405 --output-pcapng trace.pcapng --output-wireshark wireshark
RTT Tracing
Build with:
west build -p -b <board> -- -Dapp_SNIPPET=nrf91-modem-trace-rtt
Capture traces using Segger JLink RTT Logger:
JLinkRTTLogger -Device NRF9160_XXAA -If SWD -Speed 50000 -RTTChannel 1 modem_trace.bin
and then convert the captured modem trace to pcapng using the Cellular Monitor application or nRF Util:
nrfutil trace lte --input-file modem_trace.bin --output-pcapng rtt-trace.pcapng
Application logs and modem traces over RTT - Parrallell capture
For simultaneous modem traces and application logs over RTT:
Add to prj.conf:
CONFIG_USE_SEGGER_RTT=y
CONFIG_LOG_BACKEND_RTT=y
CONFIG_SHELL_BACKEND_RTT=y
CONFIG_SHELL_BACKEND_RTT_BUFFER=1
Capture in separate terminals on different RTT channels:
# Terminal 1 - Modem traces
JLinkRTTLogger -Device NRF9160_XXAA -If SWD -Speed 50000 -RTTChannel 2 modem_trace.bin

# Terminal 2 - Application logs
JLinkRTTLogger -Device NRF9160_XXAA -If SWD -Speed 50000 -RTTChannel 0 terminal.txt
It might be needed to change the channel name depending. Default should be: termina: 0, shell: 1, modem trace: 2.
For more information:
Common Issues and Solutions
If you are not able to resolve the issue with the tools and instructions given in this documentation its recommended to create an issue in the template repository or register a support ticket in Nordics support portal https://devzone.nordicsemi.com/.
Network Connection Issues
Symptoms
- Device fails to connect to network
- Frequent disconnections
Debugging Steps
- Capture and analyse modem traces
- Attach traces in ticket or issue reported to Nordic via DevZone
Hardfault
Symptons
- Device crashes
- Reboot loop
Debugging steps
- Lookup LR/PC if printed
- Debug using GDB