How to work with the Memory Explorer
The Memory Explorer is available in the nRF Debug's Panel View after you start a Debug session. It shows the memory content on your device. You can review different regions of memory data in its Flash and RAM tabs.

How to select a specific symbol
To select the memory range of a specific symbol in the Memory Explorer, complete the following steps:
-
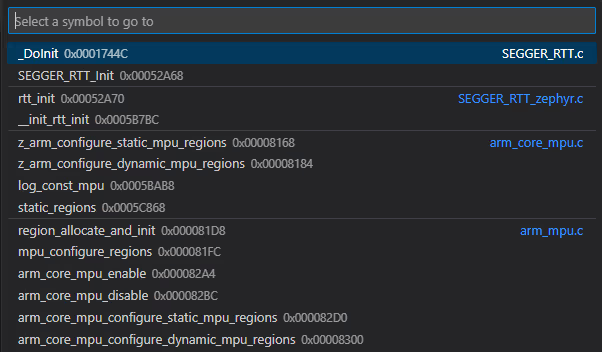
Click the Go to symbol button in the Memory Explorer Toolbar. A quick pick menu appears, which provides information about the symbol's name, its file, and its start address.

-
Click the symbol name you want to select. The symbol's memory range is highlighted in the Memory Explorer.

-
Once you are done inspecting the range and making changes, click Clear highlight button in the Memory Explorer Toolbar to clear the selection.

How to jump to a specific address
To jump to a specific address in the Memory Explorer, complete the following steps:
- Click the Go to address button in the Memory Explorer Toolbar. An input field appears.
- Write the address you want to locate in the Memory Explorer in the hexadecimal format.
For example,
0x20000018. -
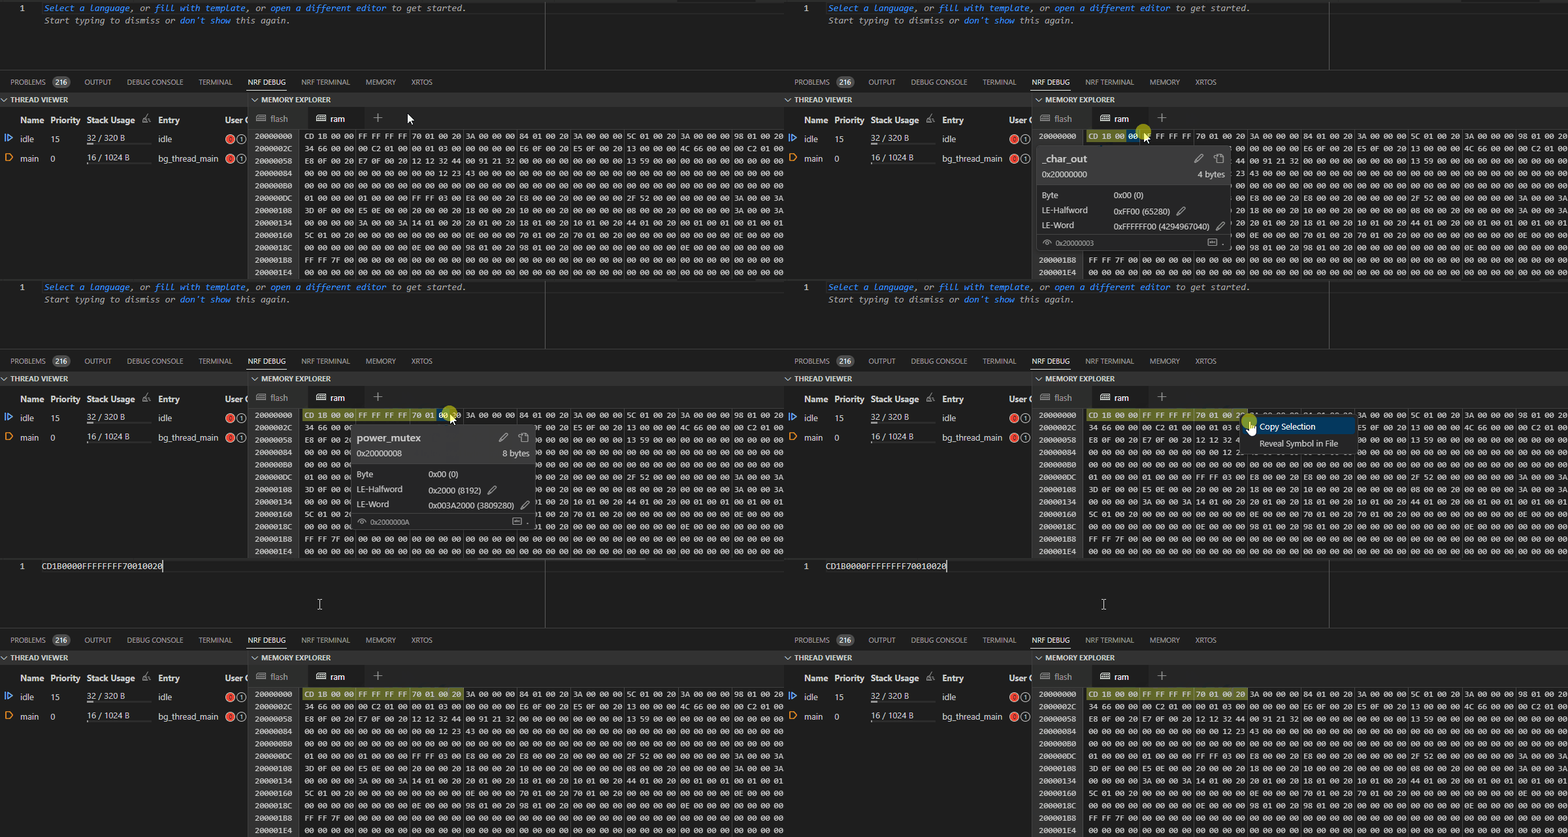
Press Enter. If the address is available in the Memory Explorer address range, the first field at the given address is highlighted in yellow.
Tip
Use the Show symbols button next to the Go to address button to see the entire address range.

-
Once you are done, click Clear highlight button in the Memory Explorer Toolbar to clear the selection.

How to copy a memory range selection
You can select and copy a range of memory symbols in the Memory Explorer. Complete the following steps:
- Click and drag with your mouse to select the desired range of memory symbols.
- Press Ctrl-C or click Right Mouse Button > Copy Selection. The entire selection is copied to clipboard.
- Paste the selection to the location of your choice.

Tip
You can also use this action for copying the ASCII values with the Show ASCII option toggled on.
How to reveal memory symbols from code
While you can use the Show Symbol in File or Reveal Symbol in File in the Memory Explorer to go to the location of the a symbol in the code file, you can also do the opposite and locate a memory symbol from the code file:
- Open the file containing the code that you are debugging and locate the symbol you want to find in memory.
- Right-click on the symbol to open the context menu.
- Click Reveal Symbol in Memory Explorer.
The extension highlights the chosen symbol in the Memory Explorer. If the symbol is not located in the symbol list, a notification appears that the symbol is not included in the compiled hex file.
How to create custom memory sections
You can add a custom memory section to nRF Debug's Memory Explorer to display and keep track of the defined device's memory address within its own dedicated tab. This is useful if you want to view a specific memory address on your device, rather than viewing all memory addresses within the flash and RAM.
You have two options for creating custom memory sections:
- Custom address - This action creates a memory section fixed to a given address range.
- ELF symbol - This action creates a dynamic memory section by the name of a memory symbol.
If your debug session was defined in a launch configuration, new sections will be saved to the launch.json file. Otherwise, the extension stores the new sections in a local storage for each build configuration, so that the same sections are available in your next debug session.
How to create a memory section for a custom address
Complete the following steps to add a custom memory section tab:
- In the Memory Explorer tab bar, click the + button. A quick pick menu appears.
- Select Custom address.
-
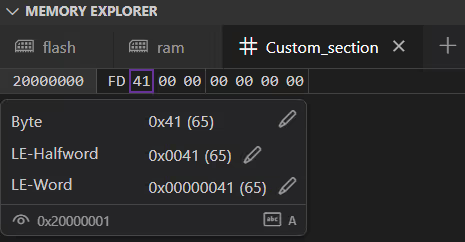
Enter a custom name for the memory section. For example,
Custom_section.Note
You cannot have two or more custom memory sections with the same name.
-
Enter the start address of the memory section. For example,
0x20000000. - Enter the size of the memory section.
For example,
8.
A custom memory region tab is added to the Memory Explorer.

Tip
You can change the icon for the custom memory section tab from its context menu.
How to create a memory section for an ELF symbol
Complete the following steps to add an ELF symbol memory section tab:
- In the Memory Explorer tab bar, click the + button. A quick pick menu appears.
- Select ELF symbol.
- Select the memory symbol name from the list.
For example, following the custom address example above, this could be the
_char_outsymbol.
The ELF symbol memory region tab is added to the Memory Explorer. The location and size of the memory symbol is determined at the start of each debug session, so if the symbol is moved or resized during compilation, the Memory Explorer will show the updated values.
How to manually add a custom memory section
You can also manually add a custom memory section directly in the launch.json file.
Complete the following steps to manually add a custom memory section tab:
- Click on the Configure debugging button (the cog wheel) that is to the right of Debug in the extension's Actions View.
This opens the
launch.jsonin your current workspace. -
Extend the configuration by adding a
memorySectionsarray to it.
The following example shows how to add a 1-KB custom section that starts at the address0xCAFE0000:Extend launch.json with a custom memory section[ { "symbol": "symbol", }, { "name": "Custom_section", "start": "0xCAFE0000", "size": 1024 }, ]- The
startproperty defines the start address of the section. - The
sizeproperty defines the number of bytes from the start address that the property should span. - Either integers or hex strings can be used for
start, and only integers are valid forsize.
A validation check is run against these values and a warning message will be shown if they are invalid.
The
launch.jsonfile should now include amemorySectionsarray and look like the following:Full configuration{ "configurations": [ { "type": "nrf-connect", "request": "launch", "config": "${activeConfig}", "name": "Launch nRF Connect application", "memorySections": [ { "name": "Custom_section", "start": "0xCAFE0000", "size": 1024 } ] } ] } - The
-
Save the file.
- Click on Debug from the Actions View.
- Once the Debug toolbar appears in the editor, click on the Pause button.
- Open the nRF Debug Panel View from the Panel (Ctrl-J).
You can now see the custom region tab in the Memory Explorer.