Version 2023.4.148
Welcome to the April 2023 release of nRF Connect for VS Code.
This release, we have been working on improving the following areas:
- Connected Devices management
- nRF Debug's Memory Viewer
- SDK management
- Application management
- Add Build Configuration workflow
- Memory report
- Actions View
- Performance improvements
- Webview styling
- Housekeeping
- Other improvements
- Bug fixes
Fixes in 2023.4.179
- Fixed an issue that caused JLink probes to not appear in the Connected Devices view
- Fixed an issue where SDK installations in other Windows drives were interpreted as part of the VS Code workspace
- Fixed an issue where the SDK selector was disabled if
nrf-connect.topdirwas set in the global configuration. - Bumped the minimum required version of VS Code to 1.74 to ensure that the
webview/contextcontribution point exists.
Connected Devices management
We updated how and what devices are discovered in the Connected Devices View.
Using nRF Util Device to populate the Connected Devices View
The new nRF Util is now used for device management, replacing nrfjprog. nRF Util supports more device types and provides live monitoring of the connected devices, so you do not have to manually refresh the view every time you connect or disconnect a device.
To support this, the extension now ships with its own isolated instance of nRF Util.
If you are having trouble with the new nRF Util device provider, you can go back to the old nrfjprog-powered view by changing the nrf-connect.deviceProvider setting to nrfjprog.
Support for nRF54
On April 12th, Nordic Semiconductor has announced a new nRF54 device, which is now available for sampling to selected customers.
This release adds experimental support for flashing and debugging the nRF54H20 SoC in Visual Studio Code. For now, debugging is only supported on the application core. We will be extending the support and tooling for this device in the coming months.
Support for other flash runners
When flashing with west flash, we were passing --runner nrfjprog to it, which would fail if the board did not support the nrfjprog runner.
To be more flexible, we are now reading the runners.yaml file to check that we're using the nrfjprog runner, and only pass nrfjprog specific arguments if we are. In other scenarios, we will only try passing the standardized arguments for serial number and erase.
nRF Debug's Memory Viewer
The new debugging environment released in September 2022 introduced an nRF Debug View with the Thread Viewer and Memory Viewer. For this release, we have revisited the Memory Viewer to improve its look and feel over the initial version.
Overall layout
We have updated the layout of the Memory Viewer to make it fit better with Visual Studio Code's overall look. The memory sections are now presented as tabs, and the styling is aligned with VS Code's text editor layout.
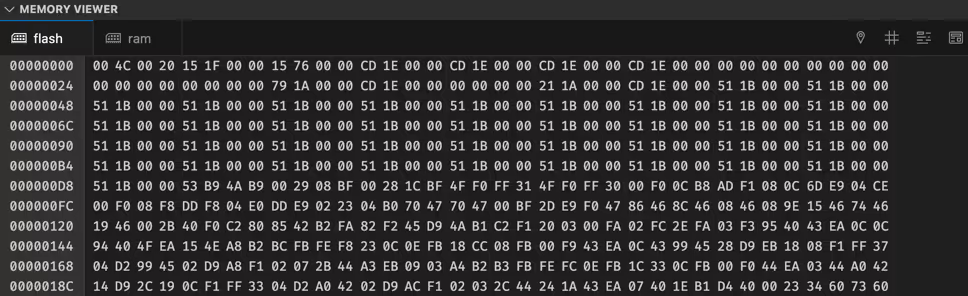
In the process, we also improved the render performance of the Memory Viewer to make navigating the device memory a bit snappier.
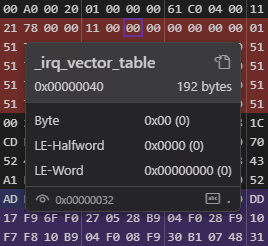
New hover tooltip
The Memory Viewer hover tooltip was reworked, and now has a new look, with more emphasis on the symbol:
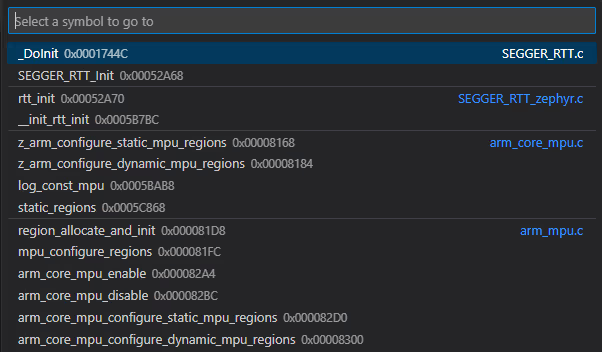
New symbol search UI
The symbol search drop-down widget in the memory view has been replaced with a native Visual Studio Code quickpick menu. The menu is easier to navigate and shows more information about the symbols than the original drop-down.
In the new menu, symbols are sorted by filename, and within each file by their start address. Symbols without a known location are listed at the bottom.
Reveal symbol in Memory View
When the debugging session is paused, there is now a new Reveal Symbol in Memory Viewer option in the editor context menu. This option will attempt to resolve the symbol under the cursor and reveal it in the Memory Viewer.
SDK management
We have restructured the way the extension detects and interacts with local nRF Connect SDK instances. This has allowed us to resolve several long-standing issues, and significantly improved the extension activation performance.
Reduced noisy SDK notifications  
The way in which the extension handled SDK and toolchain configuration issues has been a source of frustration for a long time. For this release, we have tried to address some of this frustration by removing the number of scenarios that can trigger notifications, and as a result, the extension should now be a lot more respectful of your attention. Generally, the extension will now try to stay out of sight as much as possible.
We will keep improving this over the next few releases, but we think we have been able to strike a much better balance in this area.
New application workflow
When setting up a new workspace using the Create new application workflow, the extension would post cascading notification prompts about the configuration. We implemented better configuration resolution and an improved status bar menu, which allowed us to remove these notification prompts.
The notifications that used to follow adding the application regarding conflicting SDK and toolchain are also removed. This way, if the newly added application would already contain builds that are built against different SDK, they will simply be stale and pristine build will be required.
Configuration error prompts
Notifications about how the extension cannot find the nRF Connect SDK have also been removed, and notifications about configuration issues that require attention have been moved to the Status Bar.
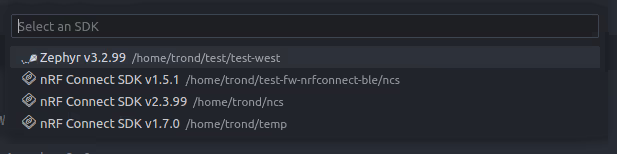
Identification of raw Zephyr installations
The extension now keeps track of which SDK installations are based on the nRF Connect SDK and which are raw Zephyr workspaces, and properly presents them with dedicated Zephyr icons in the SDK's quickpick menu.
Status Bar error behavior
The extension will communicate configuration errors by rendering its extension status item in the Status Bar with a red background. Before, clicking on the red status bar item would just show an "Open File" dialog without any context. Now, it shows a useful message about setting the SDK and toolchain instead.
Application management
Based on user feedback, we have streamlined the method for identifying the applications.
Automatically add top-level workspace folders as applications 
Applications that are included as workspace folders in the VS Code workspace are now automatically added to the application list.
This replaces the "Add workspace folder as application" prompt, and new workspaces created using the Create new application workflow will no longer add the new application to the workspace settings.
Entries pointing to workspace folders in the nrf-connect.applications setting can now be removed, but the extension will not change this automatically in existing workspaces. To remove a workspace folder from the application list, you now need to remove the workspace folder from the VS Code workspace.
Builds in subdirectories 
To avoid adding a lot of build directories directly under the application directory, some users prefer to create a single build directory that contains all builds. This workflow is now supported, as the extension scans all subdirectories of the application for build configurations, instead of just the immediate directories.
Add Build Configuration workflow
The Add Build Configuration workflow received some updates to resolve some common friction points.
Always pass selected project conf file to build system 
When selecting a prj.conf or a prj_${board}.conf as the configuration file, the extension would attempt to determine whether this would be the default configuration file chosen by the build system, and leave it out of the build command if it would be redundant.
Unfortunately, this mechanism did not cover all corner cases in the build system, and in some scenarios, the build would be misconfigured in ways that could be very hard to detect.
To fix this, we have made three changes to the configuration file setting:
- By default, the extension will now omit the configuration file argument from the build string, and use whatever the build system default is.
- If you explicitly pick a configuration file from the drop-down list, the extension will now pass this file to the build command, regardless of whether it will be redundant or not.
- When changing to a different board, the configuration file selection will always be reset to use the build system default, to prevent accidental selection of board-specific configuration files for the wrong board.
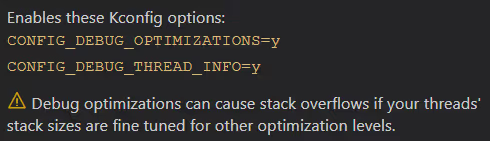
Tooltip to explain debug options 
The exact Kconfig options selected by the Enable debug options checkbox are now documented in a tooltip, along with a warning about potential stack size issues that could be caused by these options.
nRF54 in board selection drop-down
The new nRF54 boards are now listed in the board drop-down menu for selected customers that have been granted access to early user sampling.
Fix Kconfig values in pristine build
Zephyr Pull Request #49267 broke the detection of Kconfig variables passed on the command line in our build parsing mechanism. This has now been fixed, and the Edit Build Configuration and Pristine Build workflows should no longer drop Kconfig variables.
boardRoots setting update
To prevent a common configuration issue, the nrf-connect.boardRoots setting now accepts entries that point to the boards directory of a west module (both <folder>/boards and <folder>).
Memory report
We introduced some minor improvements to the memory report based on feedback received from users.
Single footprint report instead of ROM and RAM 
A new footprint build target that generates both the ROM and RAM reports at the same time was introduced in the nRF Connect SDK v1.7.0. When available, this will now be used instead of generating both reports individually.
This improves the performance of the memory report generation and prevents occasional failures on Windows caused by concurrent access to the ELF file.
RAM and ROM tabs placement swapped 
We have swapped the placement of the ROM and RAM report tabs, so that the ROM report is shown first by default, as it is often the most interesting report to most users.
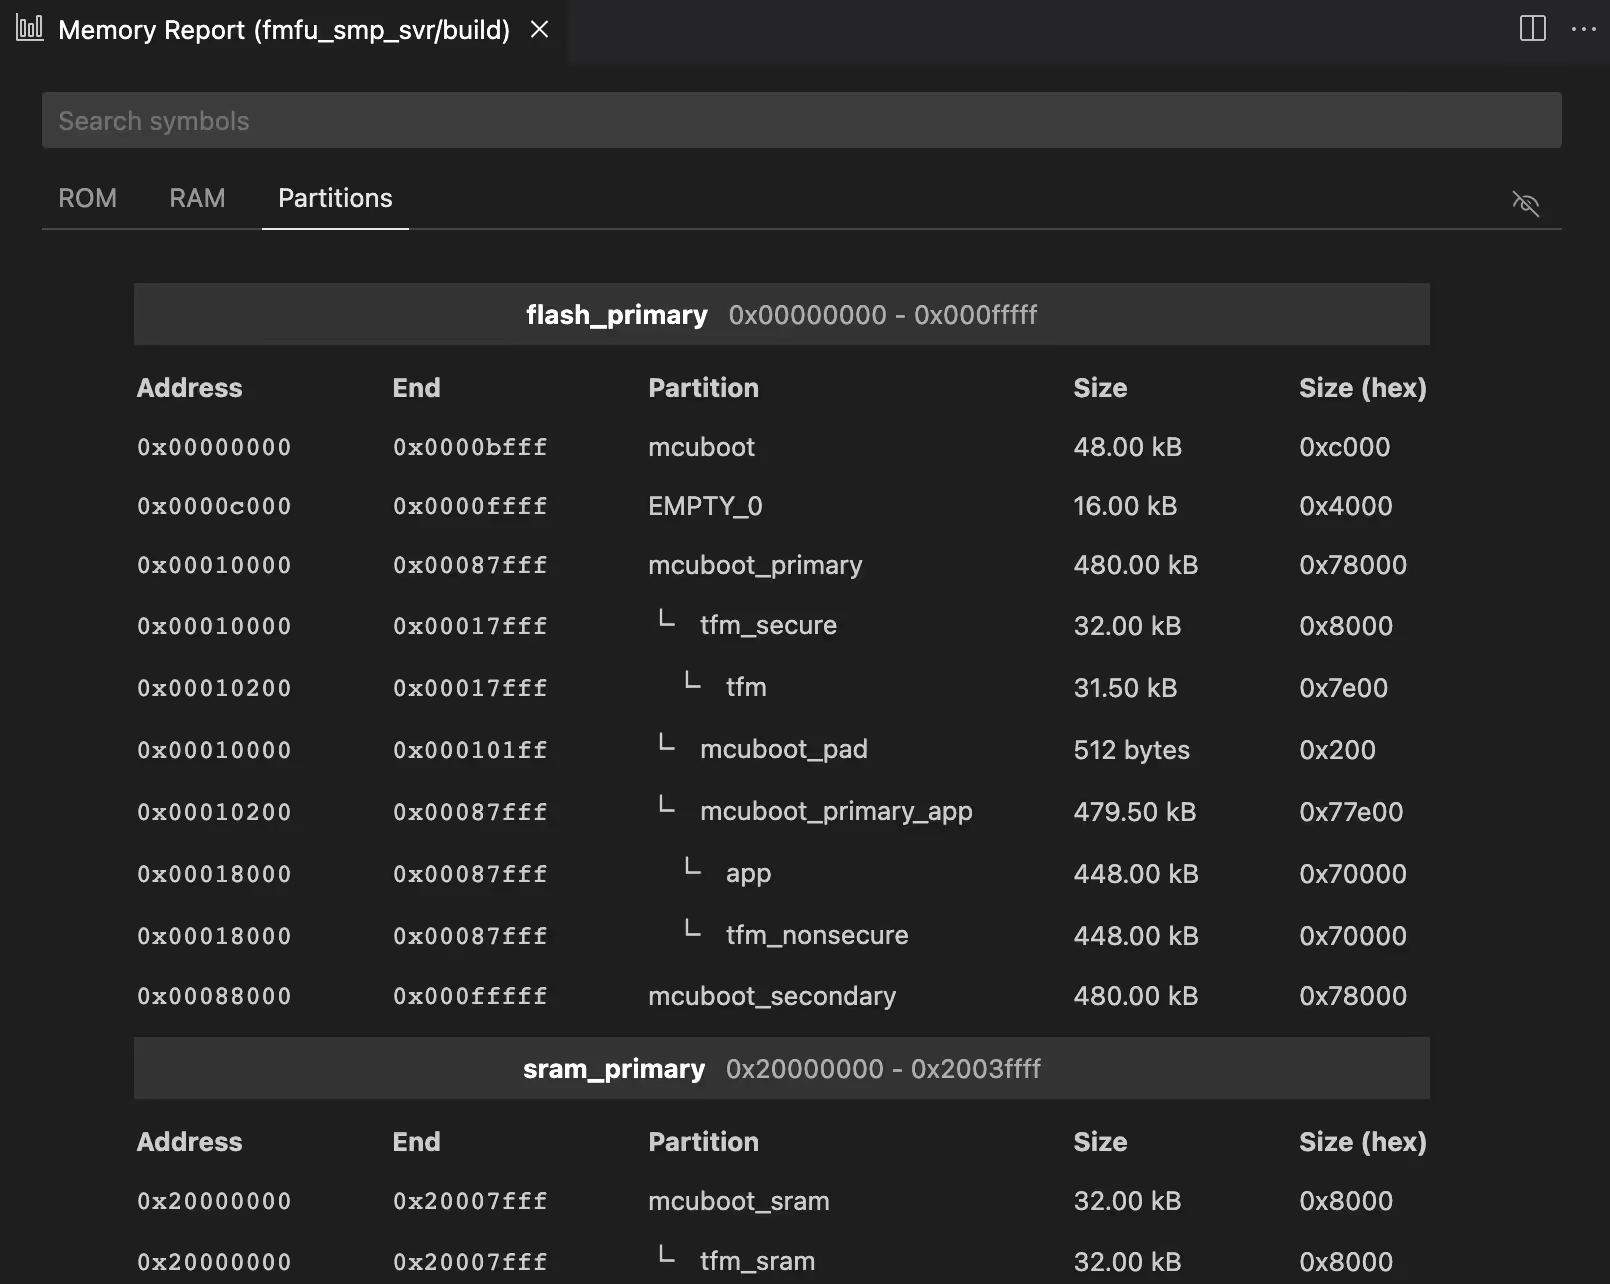
Hex size column in the partition report 
As the size of memory partitions is often specified with hex numbers in the Partition Manager, we have added a new column in the partition report:
Actions View
The Actions View received minor updates related to the introduction of the Devicetree Visual Editor.
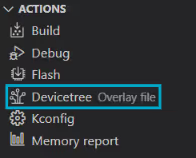
New Devicetree Visual Editor action
This release of the nRF DeviceTree extension contains the brand new DeviceTree Visual Editor. Although this editor can be opened from the Editor title bar, we have also added the Devicetree action in the Actions View.
Changed order of actions
We reordered the Actions View to put primary actions at the top and use case-specific tools at the bottom. This change does not affect the functionality of any of these actions.
Performance improvements
The extension's performance gradually degrades as we add new features, and we have spent some time resolving some bottlenecks for this release. As a result, the extension activation time has been reduced by an order of magnitude for some workspaces.
In particular, the following actions are now faster and more scalable:
- SDK discovery
- Board indexing
- Build configuration indexing
- Devicetree type listing
- Devicetree parsing
- Sidebar rendering
Webview styling
As part of our work on the Devicetree Visual Editor, we have updated the styling of most of the custom views in the extension to bring them up to date with recent developments in Visual Studio Code's look and feel.
We have also reworked some of the tooltips and added some new ones to reduce the need for checking the documentation to make sense of the UI.
Housekeeping
We updated the Visual Studio Code version used by the extension and the extension activation behavior.
Updated minimum VS Code version to 1.66
The extensions now require at least Visual Studio Code version 1.66 (March 2022) to run. You might need to upgrade your Visual Studio Code installation to get the latest version of the extensions.
Only activate extension in some workspaces
One of Visual Studio Code's biggest strengths as an editor is how many languages, frameworks and development environments it supports. To ensure that the nRF Connect extension does not interfere with Visual Studio Code's usefulness outside of development related to the nRF Connect SDK, the extension will only activate when it is actually needed.
Specifically, the extension will only be activated when you interact with it (like opening the nRF Connect extension or triggering a command the extension implements), or if the workspace contains any of the following files:
west.ymlKconfig.zephyrprj.conf*.overlaysample.yaml
In any other development environment, the extension will not start, will not generate any notifications, and will not consume any resources.
The nRF Connect icon is still present in the Sidebar to make it easy to start using the extension in new workspaces.
Other improvements
We introduced some minor quality of life improvements to different areas of the extension.
Disabled West SCM if the nRF Connect SDK is not in the VS Code workspace
The West SCM view will no longer appear if the nRF Connect SDK is not part of the VS Code workspace.
nRF Debug Peripheral View: Improved peripheral naming
Some peripherals in the nRF Debug's Peripheral View have an official name and a colloquial name, such as the GPIO port on nRF52, which is officially named P0. To make the Peripheral View easier to navigate, we are now rendering and sorting by the colloquial name, and show the official name less prominently.
New Application: Added sample name to the initial commit message 
The initial commit in a new application will now include the name of the sample it was based on in the commit message.
Updated Getting Started walkthrough
The Getting Started walkthrough, available from the Helpful Links section in the Welcome to nRF Connect page, has been updated with some additional detail and links to updated videos.
Bug fixes
Bug fixes listed below are just some of the issues that were discovered and fixed for this release.
Removed escape from quotes in defines 
Due to a quirk in CMake, defines with quotes in their value are declared with extra escape characters in their definitions in the compile commands. This caused the IntelliSense configuration for MbedTLS to break, as it relies on quoted file paths in its defines to resolve its generated configuration files. The extra escape characters are now removed.
Made IntelliSense file lookup case insensitive on Windows 
The IntelliSense configuration provider uses the "closest path" lookup method to find which compile command is closest to the open file. Unfortunately, the build system would occasionally use a capital letter for the drive (C:\), which the C++ extension never does. This caused all lookups to fail, as they had no parts in common with the commands' files. As a result, C and C++ files were parsed with the compilation flags for one of the kernel files, which did not match the flags the application files were compiled with.
Accepting spaces in shields 
When specifying shields in the build command, users can now pass the shield names with either semicolons or spaces as separators. Before, we only supported semicolons.
Task unbind with multiple configurations
We fixed an issue that prevented unbinding multiple configurations from the context menu when a Visual Studio Code task was bound to more than one build configuration.
Stopped disabling Toolchain Manager button
When the workspace contained an nRF Connect SDK installation, the Toolchain Manager button in the New Application page was incorrectly disabled.
Stopped crashing on invalid toolchain version formatting
If the toolchain's CMake file was malformed, the entire extension would fail to activate. We have now added some protection against this to let the extension recover from corrupted toolchain packages.