Panel Views
The nRF Connect for VS Code extension pack provides several custom Views and terminal profiles in this area that are specific to the nRF Connect for VS Code extension pack, alongside the standard VS Code Views (such as Problems, Output, and Debug Console).
The actions in the Panel Toolbar change depending on which Panel View you have selected.
nRF Connect channel in Output
The extension adds a separate nRF Connect channel to the standard Output View and uses it to post updates and information related to the extension, for example about available updates to nRF Command Line Tools, as in the following image.

nRF Connect and nRF Terminal profiles
The extension comes with several custom actions that are available from the Launch Profile... drop-down list (the arrow next to the plus sign icon) located in the Panel Toolbar area.
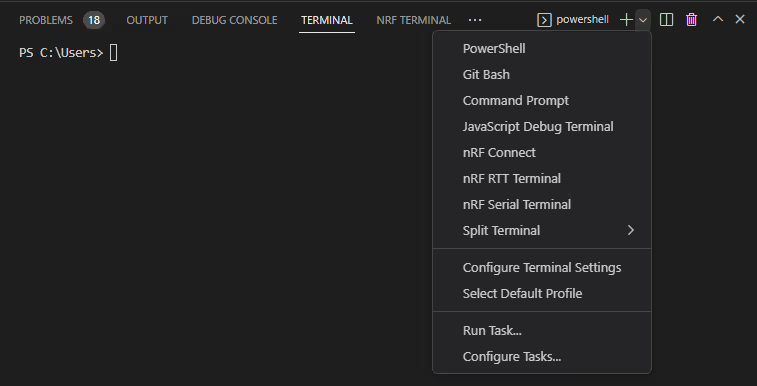
The following custom actions are available:
| Action | Description |
|---|---|
| nRF Connect | Opens an nRF Connect terminal profile that is configured to work with west and the rest of the nRF Connect Toolchain and nRF Connect SDK environment. Alternatively, run the nRF Connect: Create Shell Terminal command from the Command Palette. |
| nRF RTT Terminal | Establishes a connection to the board through RTT if it is supported on the selected device. Selecting this option frees a UART port that the serial port would use. However, you always need a SEGGER J-Link debugger connected for RTT to work. |
| nRF Serial Terminal | Establishes a connection to the board through the serial port if it is supported on the selected device. |
The RTT and serial connection actions correspond to the actions available from Connected Devices View and described in the How to connect to a device section. You can also start them from the Command Palette using nRF Terminal commands.
Tip
If you lose your serial connection, for example when your device loses power, it will be automatically restored when the cause of the interruption is solved, as long as you do not close the connection window.
This functionality is not available for the RTT terminal, which has to be reconnected manually.
Serial connection monitoring
Once connected, you can monitor the RTT or serial connection status from the Status Bar. You can start several connections at a time and move the connection windows to different parts of the UI.
nRF Connect terminal profile dependencies
The version of the nRF Connect SDK used depends on the value of the nrf-connect.toolchain.path setting at the time the terminal is created. Changes to this value are not picked up by existing terminal instances, so you need to create a new terminal to use the new environment.
All changes to the terminal environment are limited to this profile, so the default integrated terminal profile works as before.
nRF Debug
The nRF Debug View appears in the Panel View area when you start debugging an application.

The View is an integral part of the extension-specific debug type tool and provides dedicated Thread and Memory viewers.
Thread Viewer
The Thread Viewer shows information about specific threads in your application.
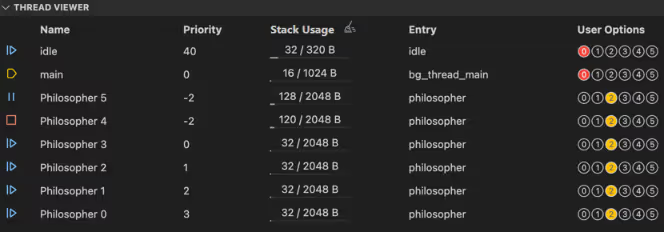
See the following table for the description of the UI element and possible actions.
| UI element (column) | Description | Actions |
|---|---|---|
| State icons | Current state of the thread, based on Zephyr's thread states. | Hover over to read the tooltip.If the thread state is Waiting, you can check the tooltip to see which object the thread is waiting for: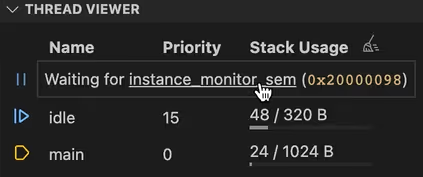 Clicking the icon or the object's name in the tooltip jumps to its location in the Editor. Clicking the icon or the object's name in the tooltip jumps to its location in the Editor. |
| Name | Name of the thread. | Hover over to reveal the address. Click to open the source code location in the Editor, if known. |
| Priority | Priority of the thread configured by the user, based on Zephyr's thread priorities. | |
| Stack Usage | Number of bytes used by the thread and the maximum number of bytes that can be allocated to the thread. | Click the Enable Tracking 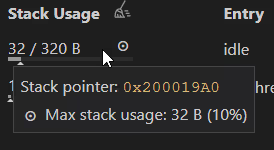 |
| Entry | Name of the thread entry point function in the code. | Click to open the source code location in the Editor, if known. |
| User Options | Binary value associated with the thread. The numbers in this column represent bit fields which are based on Zephyr's thread options. Colors are for readability only. | Hover over to reveal a tooltip that describes the values: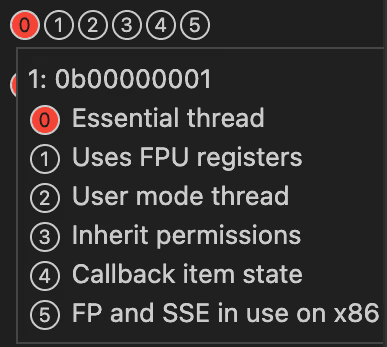 |
Memory Explorer
The Memory Explorer shows the memory content on your device. You can review different regions of memory data in its flash and ram tabs. For information about what you can do in this part of the UI, see How to work with the Memory Explorer.

Memory Explorer custom memory sections
The Memory Explorer lets you create custom memory sections.
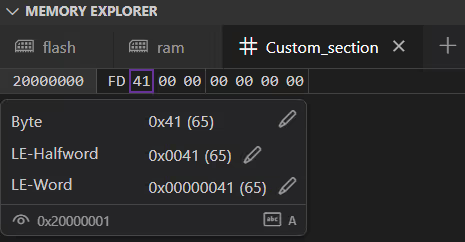
You can interact with the custom memory section tabs using the following context menu actions:
| Action | Description |
|---|---|
| Right-click the custom tab | Open the context menu for the custom memory section tab. |
| Change Icon | Select a different icon for the tab from the list of Visual Studio Code icons. |
| Reset Icon | Restore the default icon selection for the tab. |
Note
You can only change memory section tab icons for custom memory regions.
Memory Explorer tooltips
You can hover your mouse over a symbol to reveal a tooltip that includes more information about the selected symbol.
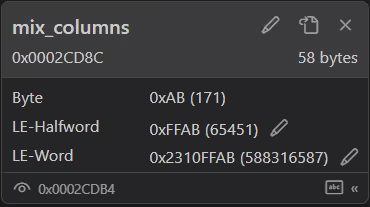
The tooltip provides information about symbol name, start address, symbol size, cursor address, symbol encoding, and others.
You can interact with the tooltip in the following ways:
| Action | Description |
|---|---|
| Click on the memory field | Make the tooltip stay in place. |
| Write to Address | Write a new two-digit hexadecimal code or ASCII value to the selected address. |
| Show Symbol in File | Open the symbol's file and location. |
| Write to Halfword | Open a menu in which you can write to the symbol's LE-Halfword. |
| Write to Word | Open a menu in which you can write to the symbol's LE-Word. |
| Close | Close the tooltip. |
Memory Explorer contextual actions
The following table lists the available contextual actions in the Memory Explorer.
| Action | Description |
|---|---|
| Write to Address | Write a new two-digit hexadecimal code or ASCII value to the selected address. This is identical to the Write to Address action in the Memory Explorer tooltips. |
| Write to Address (free input) | Open a menu in which you can write a new value to the selected address. The provided value will be parsed to the hexadecimal two-digit code or ASCII value. |
| Reveal Symbol in File | Open the symbol's file and location. This is identical to the Show Symbol in File action in the Memory Explorer tooltips. |
Memory Explorer Toolbar
The Memory Explorer's toolbar features several buttons, listed in the following table.
| Button | Icon | Description |
|---|---|---|
| Go to symbol | Opens a drop-down menu with the list of symbols that you can select. | |
| Go to address | Displays an input line to enter an address to jump to. | |
| Show symbols and Hide symbols | Toggles color groupings of the symbols presented in the explorer on and off, respectively. | |
| Show words and Show bytes | Toggles the grouping of bytes by words on and off, respectively. | |
| Show ASCII and Hide ASCII | Toggles the associated ASCII on the right side of the explorer on and off, respectively. When ASCII values are shown, you can write to them using the Write to Address action. | |
| Clear highlight | Clears the selection in the Memory Explorer. Appears only after you made a selection with the Go to symbol button. |