How to work with the Thread Viewer
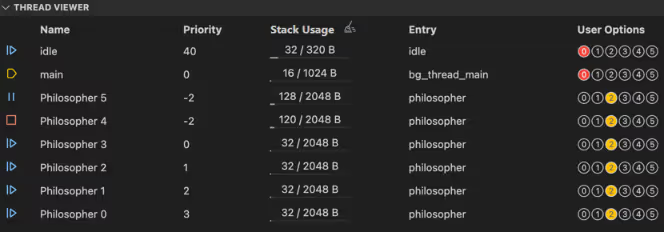
The Thread Viewer is available in the nRF Debug's Panel View after you start a Debug session. It shows information about specific threads in your application.

How to enable stack usage tracking in the Thread Viewer
The Thread Viewer lets you enable the tracking of the stack usage with the Enable Tracking button. This is useful for identifying threads that have too much or too little stack space allocated.
This feature is powered by Zephyr's CONFIG_INIT_STACKS Kconfig setting, which will set every byte in the threads' stack area to a special value as part of its initialization. The special value creates a sort of high-water mark, as the CPU will write other data in the part of the stack it is actually using, without cleaning up after itself. By looking for the first byte that is not the special value, the extension can determine how much of the stack your threads have been using at most.
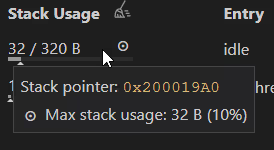
If CONFIG_INIT_STACKS is disabled, you can still enable stack usage tracking on all current threads. Press the the Enable Tracking button after you start debugging. The stack of all running threads will be initialized. You can then inspect the maximum stack usage of each thread by hovering over the stack usage graph.

Note
This approach to stack usage tracking only works for the variables on the stack you're actually writing to. If you allocate a large array on the stack without initializing or writing to it, it will not affect the maximum stack usage.