Version 2023.6.345
Welcome to the June 2023 release of nRF Connect for VS Code.
This release, we have been working on improving the following areas:
- Debugger
- Sysbuild support
- SDK management
- Toolchain management
- Build management
- Device management
- C/C++ language support
- Other improvements
- Bug fixes
Fixes in 2023.7.129
- Fixed an issue with refreshing the board roots after creating a board on Windows.
- Fixed an issue when due to unexpected format of a
sample.yamlfile the Add Build Configuration screen would not load. - Fixed an issue with initiating the RTT connection to nRF5340 from the Connected Devices View.
- Fixed an issue with a tooltip link on sysbuild type of builds.
- Fixed an issue with the tooltip edge detection that prevented the mouse from moving into a tooltip.
Debugger
Changes in this section are related to the nRF Debug View.
Memory Explorer
Inspecting memory is an important aspect of debugging embedded devices, and just like in the previous release, we've made a few improvements to the Memory Explorer (renamed from Memory Viewer).
Write support
Until now, the Memory Viewer has only supported reading memory from the device. While reading is useful for determining the state of your application, you might occasionally want to write directly to the firmware memory. This release adds support for writing to the device memory directly in the UI. To reflect this change, we have also renamed the Memory Viewer to Memory Explorer.
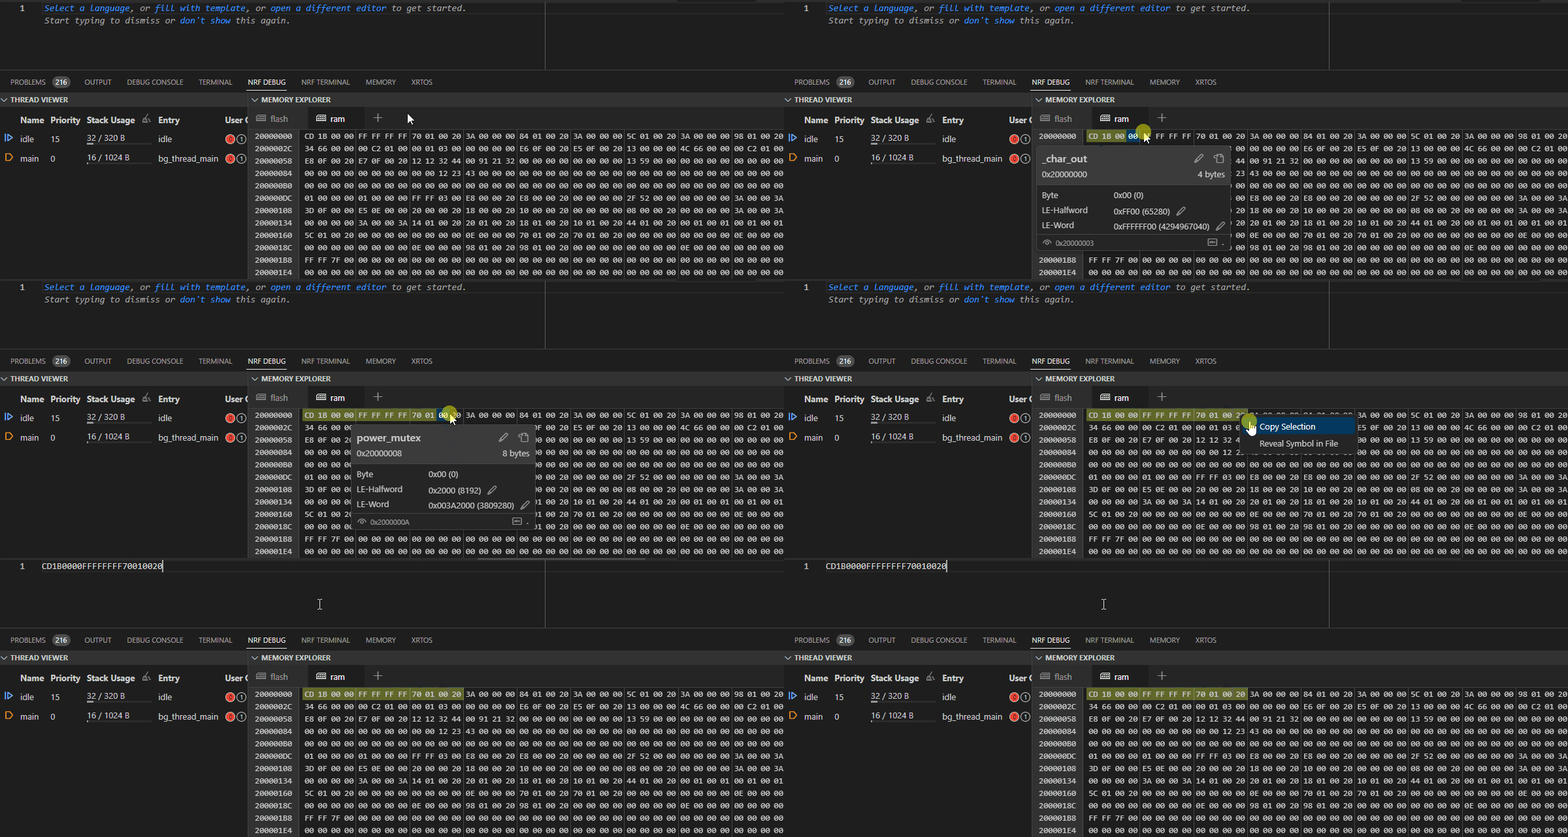
You can write to your device's memory from the Memory Explorer tooltips. The button in the top bar lets you write directly to each byte in the memory, but you can also edit memory as 16-bit or 32-bit integers by pressing the buttons next to the appropriate number.

Copy bytes
Bytes in the Memory Explorer can now be selected by clicking and dragging. To copy the raw bytes, you can right click the selection and press Copy Selection. You can also copy the valid ASCII characters in a selection by selecting them the same way. For more information, see How to copy a memory range selection.
Add memory sections from the UI
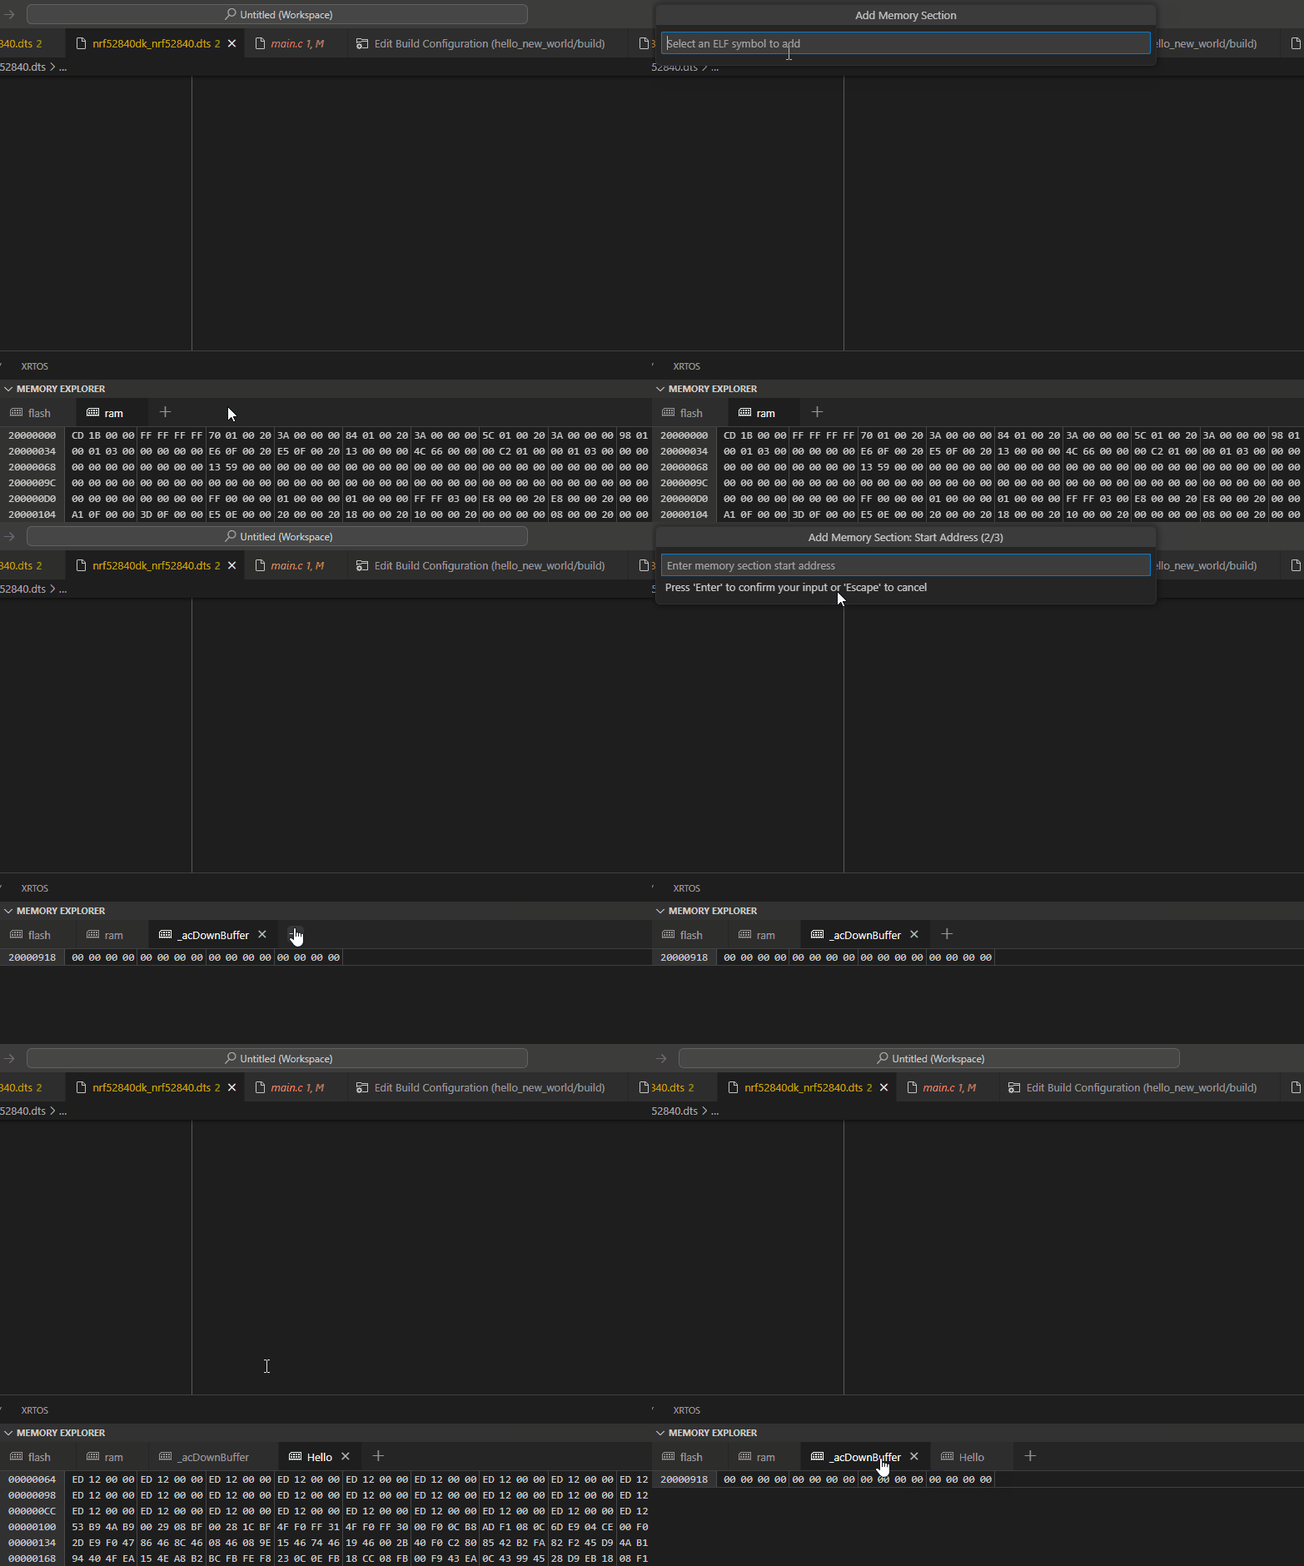
You can now add a new memory section to the Memory Explorer by clicking the new + button on the tab bar. This allows you to easily view multiple different sections of memory in one window. For more information, see How to work with the Memory Explorer.
Clear highlighted symbol
When selecting symbols with the symbol picker or jumping to a specific address, the Memory Explorer will highlight the relevant bytes with a yellow outline. This highlight can now be cleared with the new Clear highlight button on the Memory Explorer Toolbar.

Persistent Memory Explorer state
The extension now remembers the state of the Memory Explorer between sessions. The active tab, ASCII column visibility, and symbol highlight visibility are now persistent.
Thread Viewer
We added a new feature and fixed a regression in the Thread Viewer.
Show max stack usage in Thread Viewer
The Thread Viewer now features the tracking of the Stack Usage.
This feature is related to Zephyr's CONFIG_INIT_STACKS setting, which will set every byte in the threads' stack area to a special value. This creates a sort of high-level watermark, as the CPU will write other values to the part of the stack it's actually using, without cleaning up after itself. By looking for the first byte that is not the magic number, you can see how much of the stack your threads have been using at most. This is very useful for identifying threads that have too much or too little stack space allocated.
To improve this workflow, the Thread Viewer now analyzes the maximum stack usage for you. If you enable the CONFIG_INIT_STACKS setting, all new threads will be set up to track the maximum stack usage from the start. You can also press the new Enable Tracking button next to the Stack Usage header to paint the stack of all running threads.
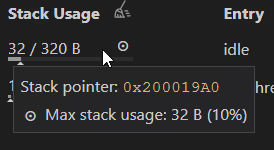
You can inspect the maximum stack usage of each thread by hovering over the stack usage graph. We've also added a tiny marker to the stack usage bar to let you get an impression of the usage for each thread at a glance.
Note
The stack painting approach only works for the variables on the stack you're actually writing to. If you allocate a large array on the stack without initializing or writing to it, it will not affect the maximum stack usage.
If you want to read more about this approach to measuring the stack usage, read Noah Pendleton's recent post on Memfault's Interrupt blog, which inspired us to add this feature to the extension.
Fix thread stack size in nRF Connect SDK v2.4.0  
The Thread Viewer was affected by a regression originating in the nRF Connect SDK v2.4.0. Zephyr PR #54446 removed some symbols the stack usage graph was depending on, so we have added a workaround until a proper replacement can be added. This does not affect older versions of the nRF Connect SDK.
Peripherals View
We have fixed a couple of issues in the Peripherals View.
Fixed CLR register behavior
On Nordic Semiconductor's hardware peripherals, some registers exist in three forms: read, set and clear.
To avoid clearing bits unintentionally, the clear registers' behavior is counter-intuitive: to clear a bit in a register, you have to write a 1 to it in the clear register, and writing 0 to it has no effect.
The Peripherals View did not take this counter-intuitive behavior into consideration when interacting with these registers, and would include the rest of the register contents along with the selected bit, which caused all bits in the register to be cleared.
These registers are now treated specially, and clearing a bit will only write to that specific bit. This does not affect the behavior in other register types.
Additionally, the extension now skips the quickpick when interacting with a register field that only has one valid selection, such as the clear register.
Fixed sorting of peripherals in the Peripherals View
We fixed a minor issue where GPIO (P0) and GPIO (P1) was sorted by "P" and not by "G".
Removed dependency on Cortex-Debug
We switched the default debugging experience from Cortex-Debug to Nordic Semiconductor's own debugger in the September 2022 release. As the integration of Cortex-Debug with the extension has been causing some overhead and confusion, we decided to stop bundling it and present a single debugging experience for the extension.
Sysbuild support
Sysbuild was introduced in Zephyr's v3.2.0 release, and has been adopted in the nRF Connect SDK v2.4.0. Sysbuild will gradually become the new workflow for handling multi-image build configurations and it will replace the child image mechanism, specific to the nRF Connect SDK.
The VS Code extensions now support sysbuild when working with nRF Connect SDK v2.4.0 and newer. This affects different areas of the extension, as described in the following sections.
Sysbuild checkbox in Add Build Configuration
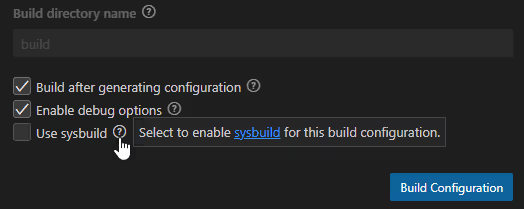
When working with nRF Connect SDK v2.4.0 or newer, a new Use sysbuild checkbox now shows up at the bottom of the Add Build Configuration screen. The default state of this checkbox is determined by the sysbuild configuration option for west. Enabling it will make the extension pass --sysbuild to west build, making the top build folder a sysbuild folder, with the application as a child image. Any sysbuild-specific CMake or configuration files will be picked up by default.
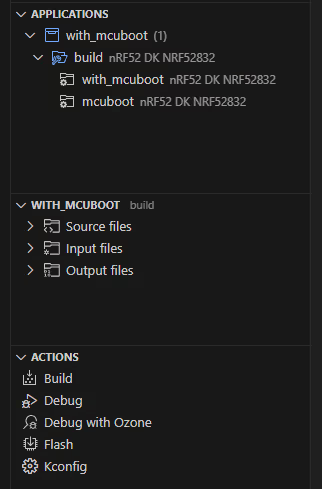
Sysbuild in Sidebar Views
Build configurations that use sysbuild are now interpreted properly, and their appearance in the Sidebar Views is different from traditional builds:
-
- The source files section now includes the source files of all child images, as sysbuild-based build configurations do not have any source files of their own.
- Input and output files are sysbuild-specific.
-
Devicetree View: There are no devicetree files for sysbuild, so all devicetree actions and views are hidden.
- Actions View: There is no common Memory Report for sysbuild-based build configurations, so this action is hidden.
Disabled pristine build on all child images
Child images are controlled by their parent, and the extension cannot accurately keep track of the exact parameters of each child image. Instead of risking the extension breaking child image builds, the Pristine Build action is now disabled on all child images. To perform a pristine build on a child image, you now have to run a pristine build on the parent image.
Showing multiple progress bars for multi-image builds
Child image builds have often desynchronized the building progress bar, as the extension did not detect when a child image started building as part of a build process. This caused the progress bar to look like it was stuck on 95% while the parent image completed its build process.
With sysbuild, this problem is accentuated, and we decided to revamp the progress bar mechanism for multi-image builds. Now, when building a configuration with child images, each child image will show up with its own progress bar to avoid the problem of the main build hanging.
Other changes related to sysbuild
In addition to the major changes above, the introduction of sysbuild required the following minor tweaks and changes:
- Debugging now uses the main application as the primary image, and will use this to determine which
mainfunction to halt at on entry. - Extra CMake arguments added to a sysbuild configuration by west are no longer duplicated when running pristine build.
- The Sidebar Views are now refreshed automatically when a sysbuild image is built. As the mechanism for refreshing the Views is normally triggered by changes to the ELF file, which Sysbuild does not have, you might have to manually refresh the sidebar after building on command line.
- Sysbuild images cannot be saved as CMake Presets, as the build system does not support this for sysbuild.
- Sysbuild-specific information is now shown in the build configuration tooltip.
- nRF Kconfig, Guiconfig, and Menuconfig now run on the sysbuild's Kconfig context when triggered from the Actions View.
SDK management
The workflow for managing and downloading the nRF Connect SDK and its toolchain is currently based around nRF Connect for Desktop's Toolchain Manager application. While this provides a streamlined workflow for getting started with new nRF Connect SDK projects, it is not compatible with Zephyr's workflow centered on west. This means that it is harder to set up workspace applications, target a fork or an unreleased branch of the nRF Connect SDK, and use third-party SDKs or raw Zephyr installations.
To support these workflows and remove the reliance on nRF Connect for Desktop, we will be adding several new tools for managing your workspaces and toolchains directly in VS Code. While it is not yet possible to bypass nRF Connect for Desktop (or command line west commands) entirely, we have started making changes to the VS Code extensions to provide full control over your development environment without relying on additional tools or downloads.
Falling back to pointing to newest SDK
If no default SDK can be determined from the environment, the extension falls back to the newest nRF Connect SDK installation on your machine. If all SDKs are raw Zephyr installations, the extension uses the highest versioned Zephyr installation instead.
Keeping track of browsed SDKs across sessions
If you use the SDK selection UI to browse to a valid installation of the nRF Connect SDK that was not registered with CMake, the extension now remembers this SDK for your next session and provides it in the list of available SDKs.
Scanning all west projects for boards
All west projects can be Zephyr modules with board definitions. Despite this, the extension only looked for boards in the workspace folder, in folders listed with the board roots configuration, and in the zephyr and nrf directories.
To ensure that all boards that are discoverable by west are made available, the extension now looks for board definitions in all west projects.
Updated west manifest schema
The VS Code extension's west manifest validation has not been keeping up with new features in west, and some valid manifests would get flagged with errors. This release, we have updated our schema for west manifests to work with all features in west v1.0, including the following fields:
self.userdatagroup-filter- Allowing number for
versionandrevision
Only update settings when making changes in the Quick Setup  
The Quick Setup section of the Welcome page would automatically store the selected Toolchain and SDK as soon as you opened the Welcome View. Now that both settings have proper fallback values, this occasionally disruptive behavior no longer served a purpose, and has been removed.
West Source Control section
To avoid mixing up the west update and view refresh buttons, we have changed the icon for the west update command to a download icon in the west section of VS Code's Source Control View (Ctrl-Shift-G).
Additionally, the extension now updates this View to keep track of the active SDK instead of being stuck on whatever SDK was (or was not) active at the start of the session.
More robust SDK version parsing
The available SDKs are presented with their version number, which is parsed from the VERSION file in either the nrf or zephyr folder. Additionally, the versions are sorted by their version number.
To support this, the extension has to interpret the versions as semantic version numbers, which could fail if the VERSION file was malformed. Unfortunately, malformed versions could crash the extension in certain corner cases, but this has now been fixed.
Toolchain management
Along with the changes to the SDK management workflow in VS Code, we are also reworking the way you manage Nordic Semiconductor's nRF Connect SDK Toolchain and nRF Command Line Tools.
This release marks the first step towards separating the toolchain installation from the SDK download and moving the entire process into VS Code, instead of going through nRF Connect for Desktop.
Install and uninstall Toolchain packages
Toolchain packages can now be installed directly from VS Code through the nRF Connect: Install Toolchain command available in the Command Palette.
While the installation process works, we have not promoted this workflow to the sidebar yet, as we want it to be part of a larger toolchain management user experience rework.
Install and update for nRF Command Line Tools
In addition to the nRF Connect SDK Toolchain package, you need an installation of the nRF Command Line Tools to interact with Nordic Semiconductor's devices. While these tools are available on the Nordic Semiconductor's website and they are bundled with nRF Connect for Desktop, it is easy to miss them when approaching the nRF Connect SDK from VS Code.
The extension will now look for a valid and up-to-date installation of the nRF Command Line Tools on startup, and provide an option for installing the newest version directly from VS Code.
Whenever there's a new release of the nRF Command Line Tools, the extension will let you know through its Status Bar item in the bottom right of the VS Code window.
Improved Toolchain picker command
When picking a toolchain through the nRF Connect: Select nRF Connect SDK Toolchain command, the extension would show a series of toasts that served no purpose. These have been removed to make this command a bit more approachable.
Additionally, the path of each toolchain installation is now shown along with its version number.
Fix minor issues with the Toolchain picker in the Welcome View
There were several issues with the toolchain picker in the Welcome View:
- The toolchain selected from the browser would be set in the settings, but the selector would still show "Select a toolchain...".
- If the toolchain selected from the browser was invalid, the info window made it look like the previous toolchain you set was invalid.
- If you picked a toolchain that was valid, but the version was too low, it would look like no toolchain was selected.
- The Quick Setup screen had several duplicate states that only added to the confusion.
- The toolchain validation would occasionally run on the previously selected toolchain, making its result inconsistent.
These issues have all been fixed by removing the minimum toolchain version check and by inserting valid browsed toolchains into the toolchains array.
Build management
We have made a few tweaks to the Applications View and the Build Configuration setup.
Allow removing workspace folder applications  
Since the previous release, the extension has been adding workspace folders to the application list automatically. With this change, we disabled the Remove application button on these applications, as they could not be removed without removing the workspace folder from the VS Code workspace.
With changes introduced in this release, the button is no longer disabled for these applications. Instead, when you click it, the extension now shows a prompt that explains how removing the application will remove the entire folder from the workspace. If the prompt is accepted, the extension now removes the folder from your VS Code workspace. This only works for workspaces with more than one folder, and the button will still be disabled for single folder workspaces.
Fixes for the Copy Build Command button
The Copy Build Command button in the build configuration details tooltip allows you to copy the exact build command invocation as a command line string.
There was a small bug with this string that made it show a prompt for picking the build configuration, even though the build configuration should have been inferred from context.
Additionally, the build configuration would print with backslashes as path separators on Windows, which did not evaluate correctly on the command line for all terminals. The extension now writes the paths with forward slashes on all platforms.
Stopped hardcoding NCS_TOOLCHAIN_VERSION into build configuration details
This entry does not display really meaningful information, and will no longer show up in the CMake variables section of the build configuration details.
Fixed crash on Add Build Configuration screen on broken CMake Presets files
When the CMakePresets.json file for an application had been corrupted or contained invalid JSON, it would block the Add Build Configuration screen from starting correctly. This issue has been fixed.
Fixed active build switching  
There were a couple of minor bugs in the implementation of the mechanism that automatically switches the active build configuration when opening a file from another application:
- The extension no longer switches away from a build when opening its input files.
- The active build configuration now switches between builds of the same application if you open a file in its build directory.
- The extension will check for generated files in all descendant child images, and not just the immediate children of the root build configuration.
Fixed handling of sample.yaml multiline platform_allow  
To populate the Compatible boards list on the Add Build Configuration screen, the extension parses the application's sample.yaml file. In some corner cases, the extension would fail to list some of the boards. This issue has been fixed.
Device management
The following changes affect the Connected Devices View actions.
Allow cancelling device actions  
We have added a Cancel button on the erase, reset, and recover progress bars, as we have gotten reports about these commands hanging in certain scenarios.
Restored Remove Device Alias command
Fixed a regression in the previous release, that made the Remove Device Alias action fail to show.
C/C++ language support
The nRF Connect for VS Code extension relies on Microsoft's C/C++ extension for C/C++ language support and diagnostics.
We have tweaked the way we interact with this extension slightly to improve the experience.
Never pass non-existing compilers to cppTools
The C/C++ extension force-reveals an output window with an error message if the compiler listed by CMake does not exist. This can happen if a build configuration has been built with a toolchain that was later uninstalled or moved. To avoid this, nRF Connect for VS Code now checks the existence of the compiler, and falls back to the current toolchain's compiler if it does not exist.
Escaping nested quotes in defines  
The previous release contained a fix for quotes in defines passed to the compiler on the command line. While this fixed this particular instance of this issue, there were still a few corner cases that did not work as expected.
This release, the extension extends this quote-escaping mechanism to work for all corner cases, ensuring that defines with empty values or nested quotes got the same values in the IntelliSense configuration as they will in the build process.
Other improvements
Added support for upcoming build system variables
Zephyr pull request #57994 introduces two new build flags for passing configuration files for Kconfig and Devicetree to the build.
This change has not made its way into a release of the nRF Connect SDK yet, but needed some changes in the VS Code extensions to work as expected.
Disabled opening the tasks file on unsaved workspaces
The Open Tasks File action did not work in unsaved workspaces, and has been disabled.
Freetext board revision setting  
The intent of the board revision mechanism is that users should be allowed to specify the revision of their actual board, which may not directly match a revision in the build system. This way, the maintainers can define new board revision files for major changes, and the build system will use the most recent revision's configuration until there is a new one.
The extension used to present this field as a drop-down of all defined revisions, but since this does not allow you to specify the exact revision of your board, it has been changed to a freetext field.
Bug fixes
This release also comes with minor bug fixes. These are not related to any of the items listed above.
Fixed support report generation when J-Link could not be be executed
If J-Link was missing or broken, the Generate support information button would not run correctly, making it harder to identify any other issues with the local environment.
Fixed duplicate environment path on Windows
Under certain conditions, Windows' PATH variable could still be duplicated with different casing in the toolchain.
Fixed generated links to sample sources  
The URL used for source files in the Sample Browser window was missing a v in front of the version number, which made the Open Documentation button point to a non-existing page.